Chapter 11 Seasonal Plots
Seasonal plots are a graphical tool to visualize and detect seasonality in a time series. Based on a selected periodicity it emphasizes the seasonal patterns and also shows the changes in seasonality over time. Especially, it allows to detect changes between different seasons.
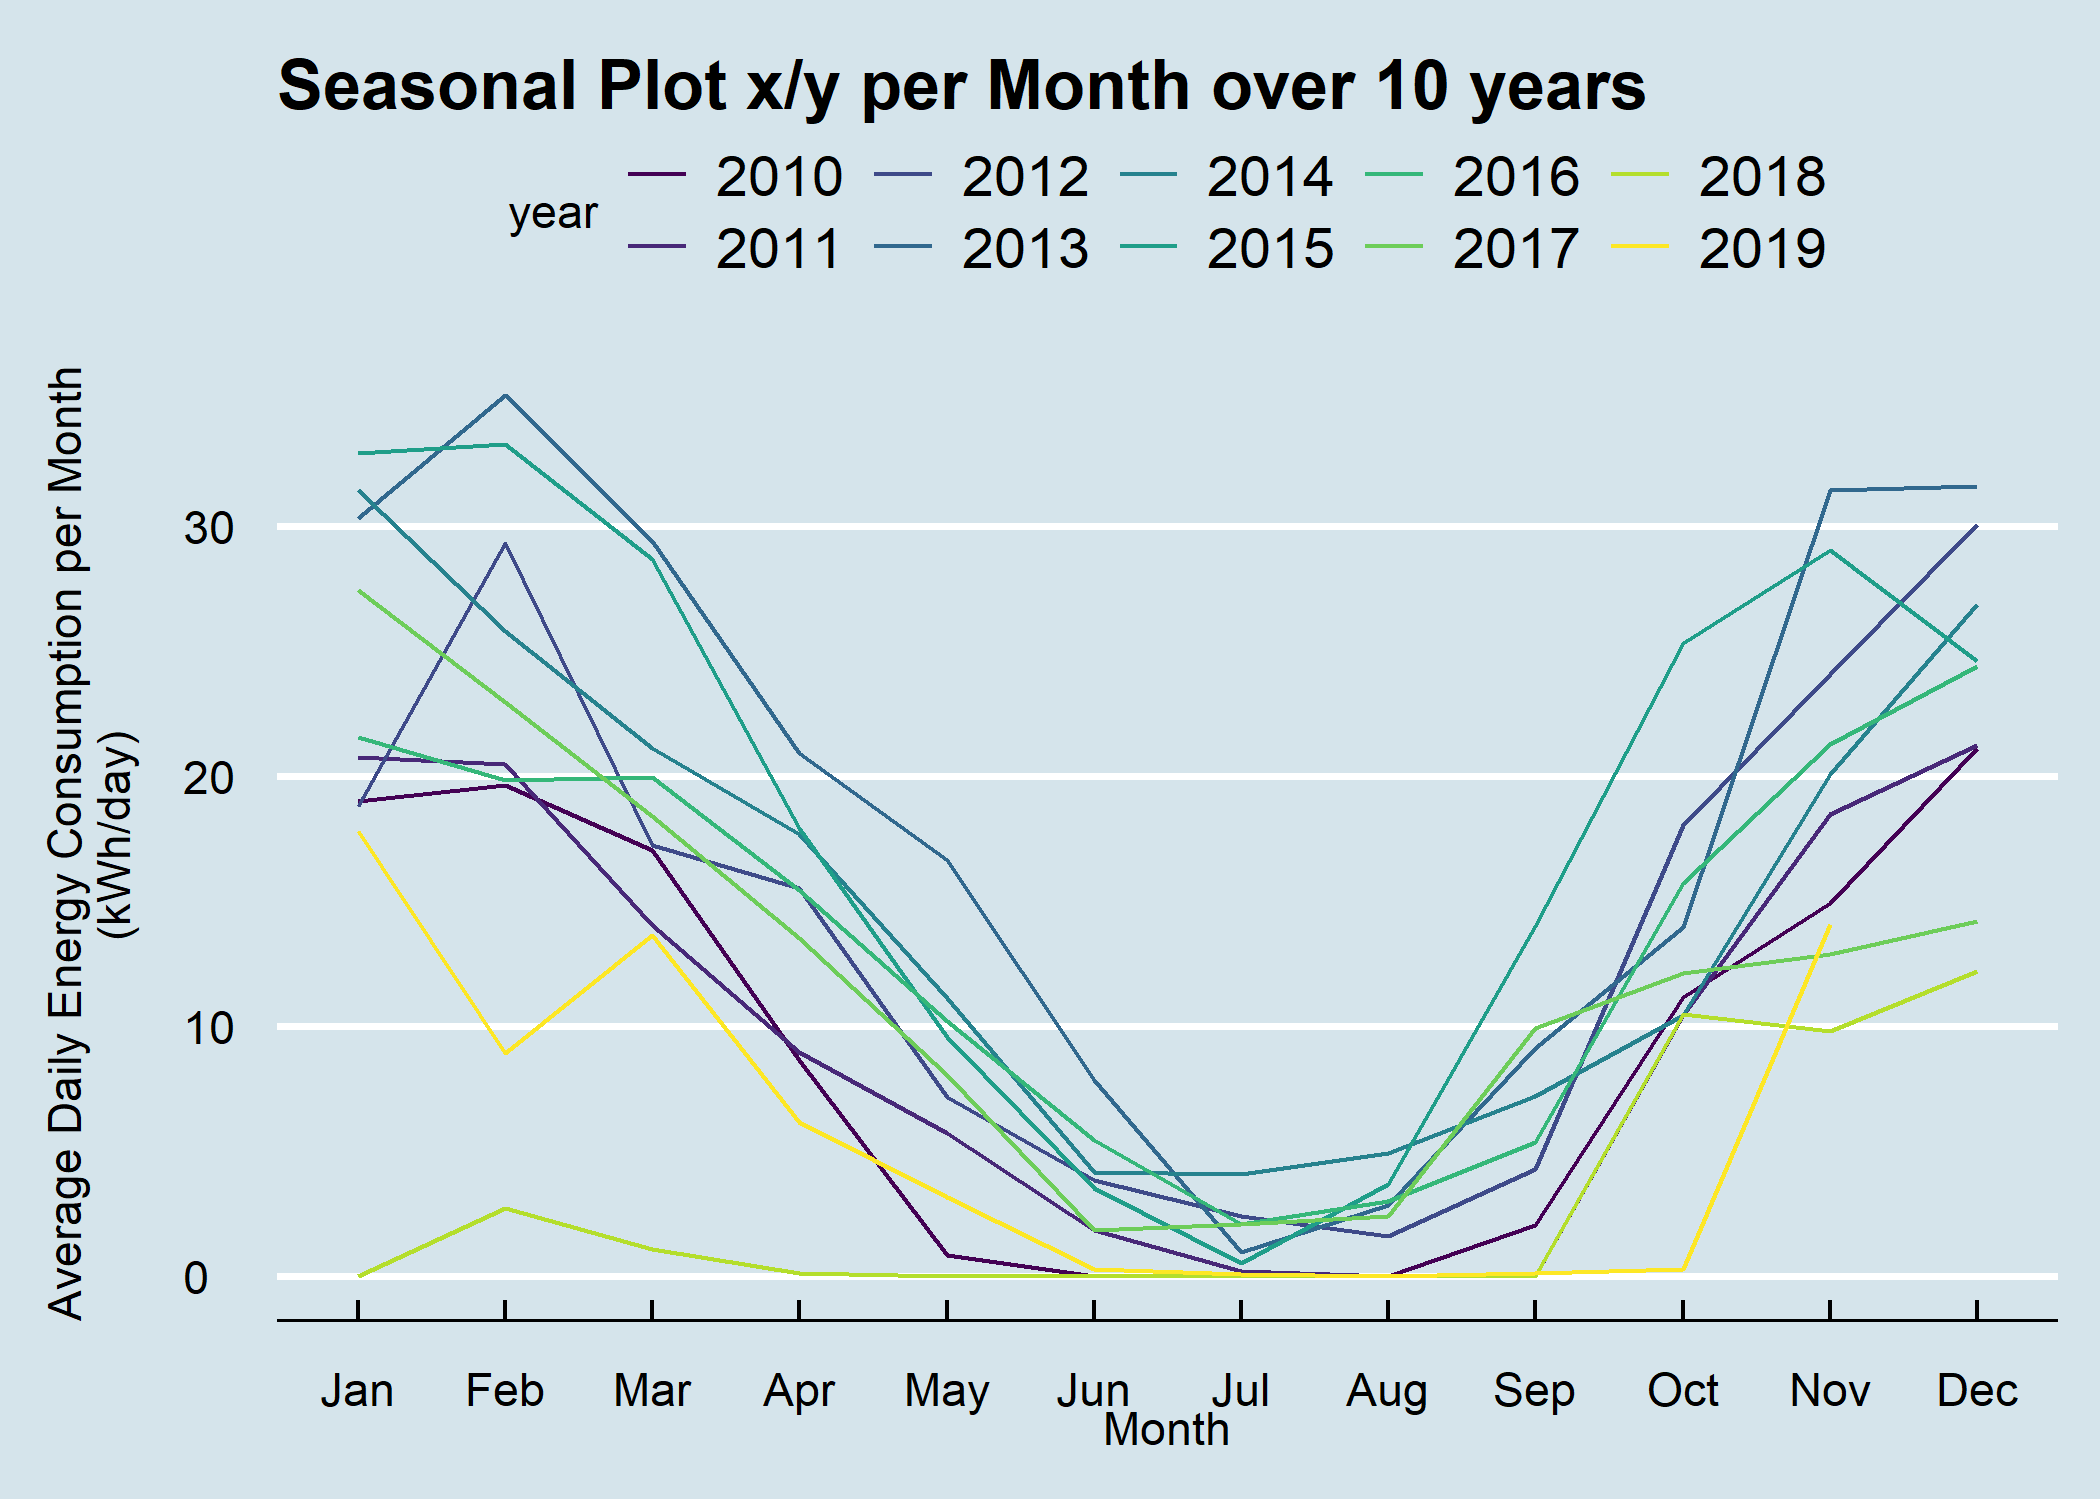
Figure 11.1: Seasonal Plot Overlapping per Month over 10 Years
This is like a standard time series plot except that the data are plotted against the “seasons” for each year and are overlapping. Be aware that seasons in this context don’t correlate with the seasons of the year. For example in 11.1 the seasons are months.
When displaying the data in months, it is important that the consumption is calculated down to a daily value, otherwise there will be unnecessary distortions due to the different number of days per month.
However, such plots are only useful if the period of the seasonality is already known. In many cases, this will in fact be known. For example, monthly data typically has a period of 12. If the period is not known, an autocorrelation plot or spectral plot can be used to determine it.
This chapter shows some useful types of seasonal plots.