13.4 Decomposed
13.4.1 Goal
Create a plot of detrended mean data per week as recommended in “Building electricity consumption: Data analytics of building operations with classical time series decomposition and case based subsetting”, Pickering et al, 2018:
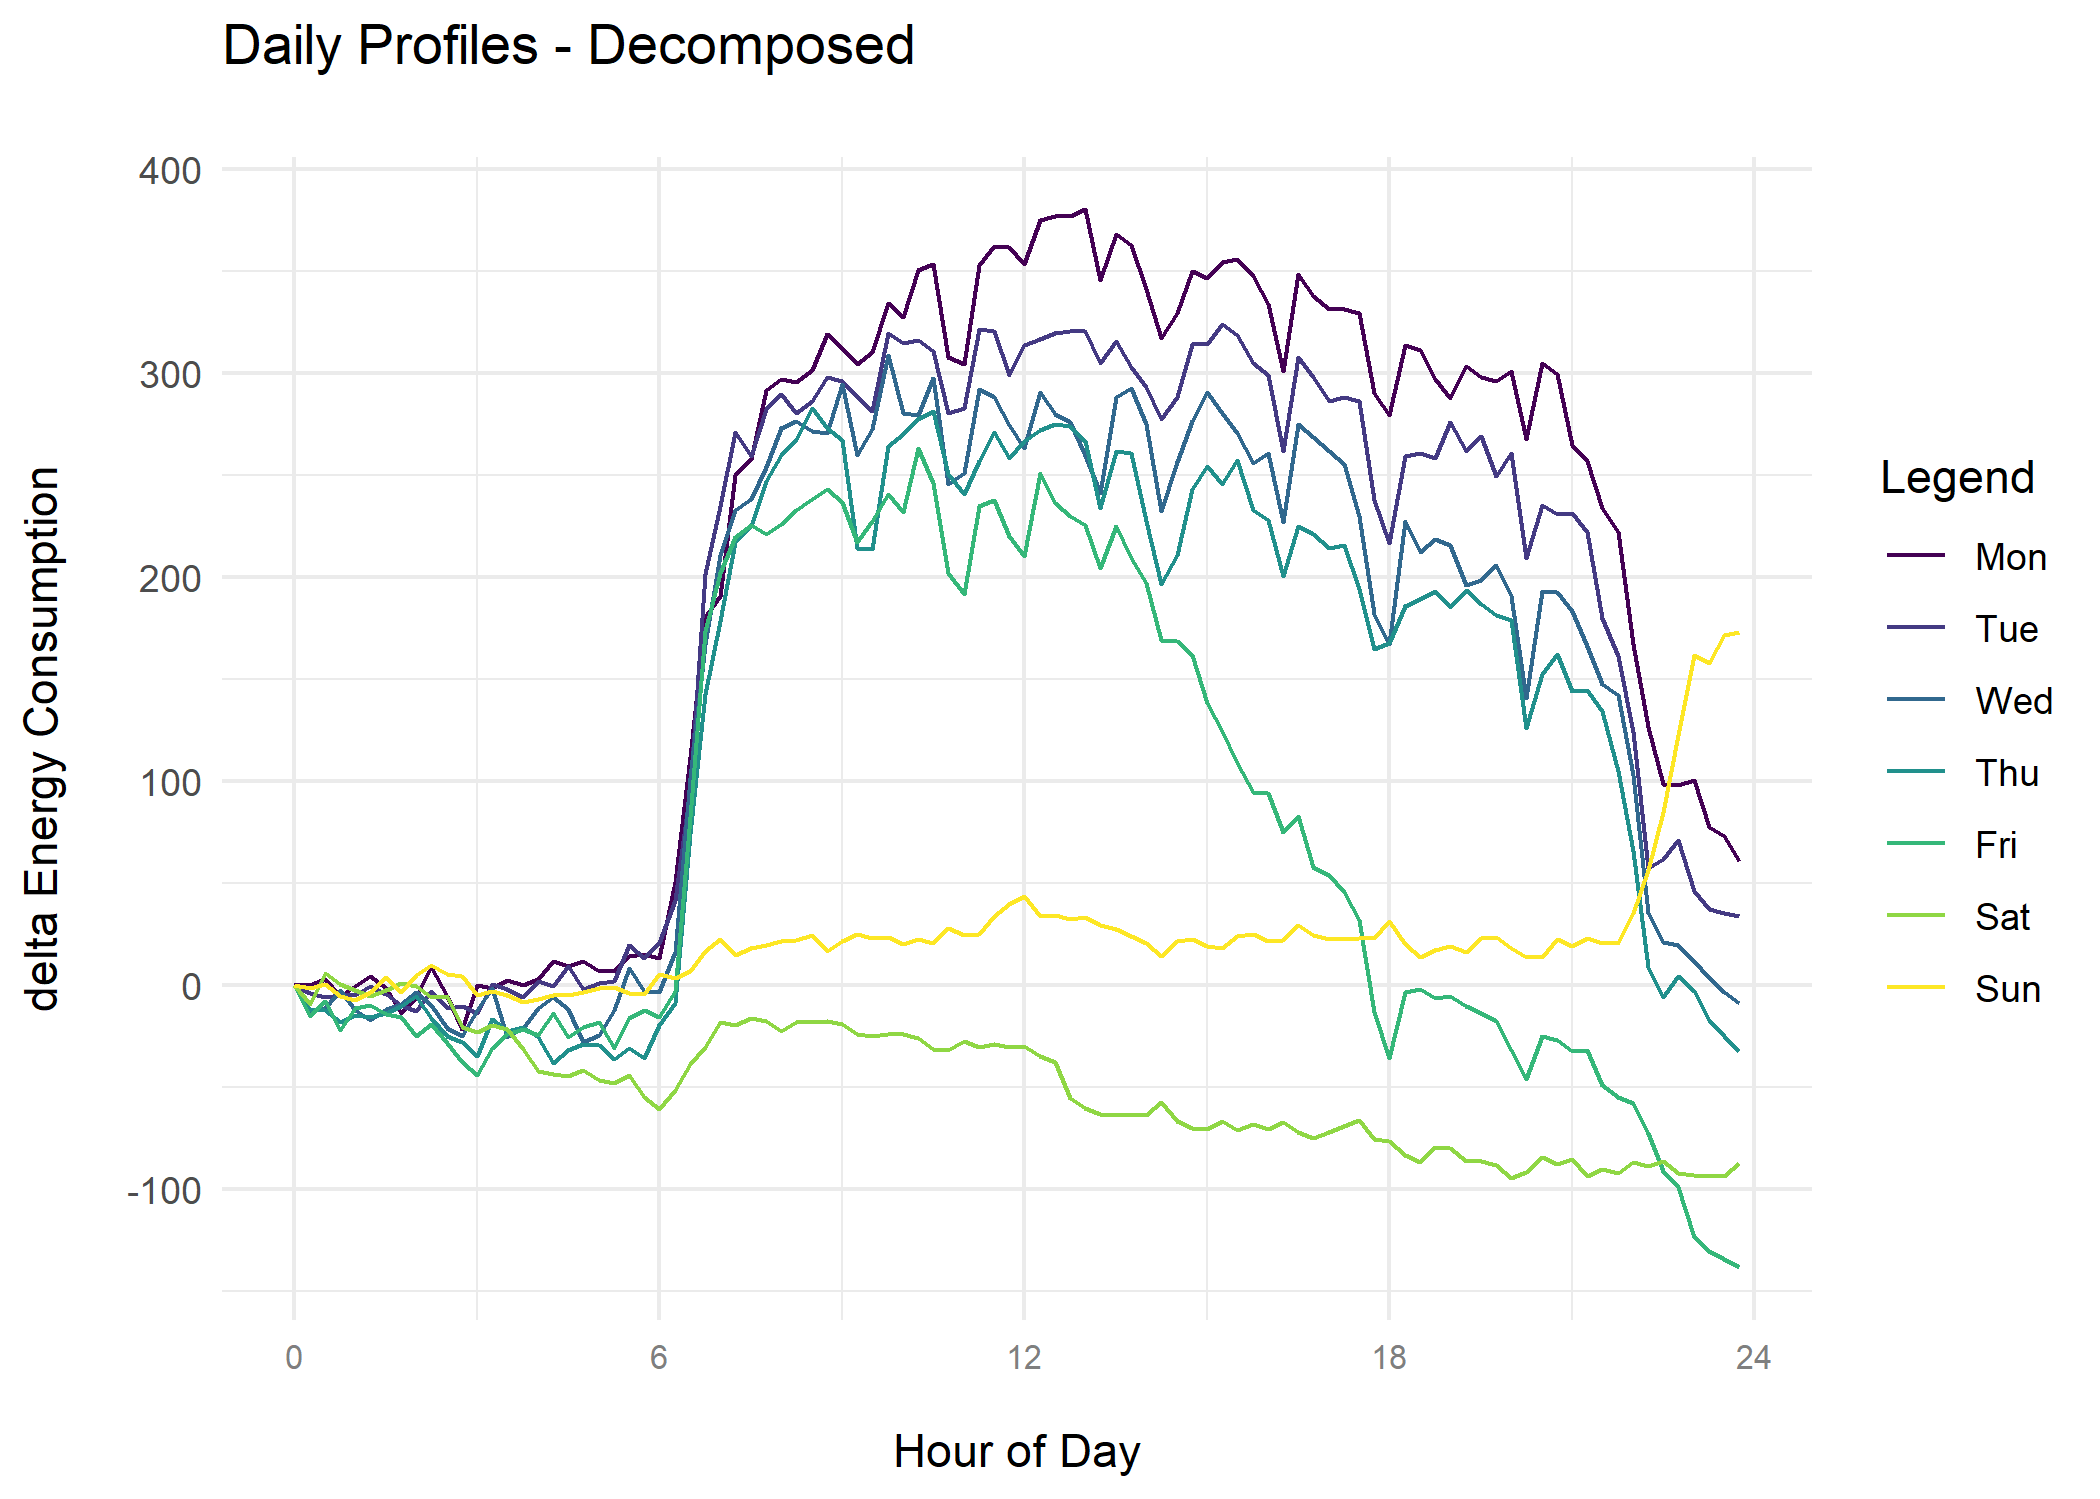
Figure 13.7: Mean Daily Profiles per Weekday
13.4.2 Data Basis
Energy consumption values of one whole year in an interval of 15mins.
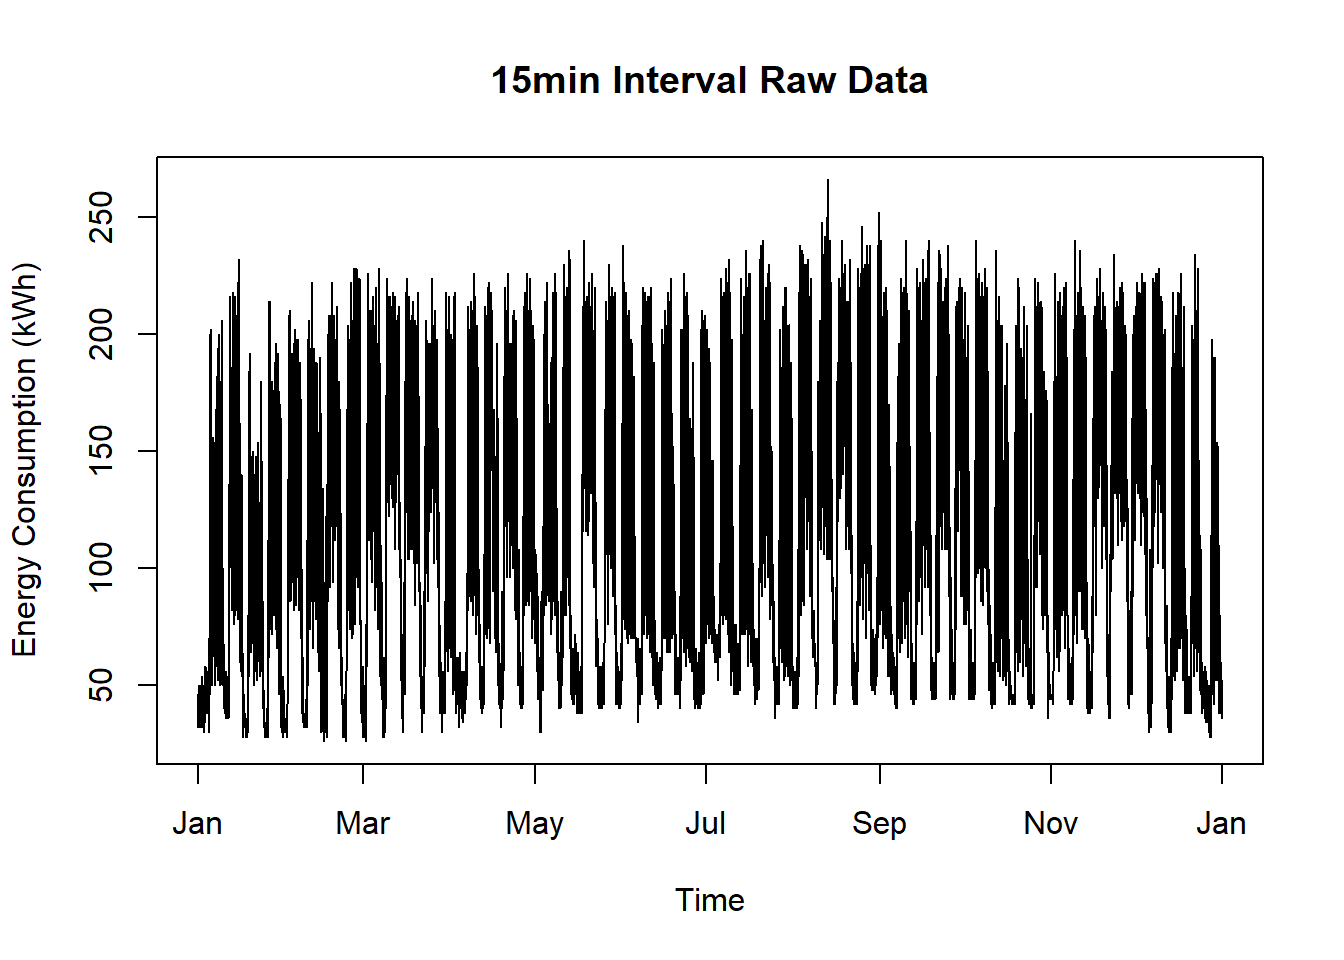
Figure 13.8: Raw Data for Decomposition Plot Short Term
13.4.3 Solution
Create a new script, copy/paste the following code and run it: