9.1 Boxplot
9.1.1 Goal
You want to create a boxplot:

Figure 9.1: Building Energy Signature Plot
9.1.2 Data Basis
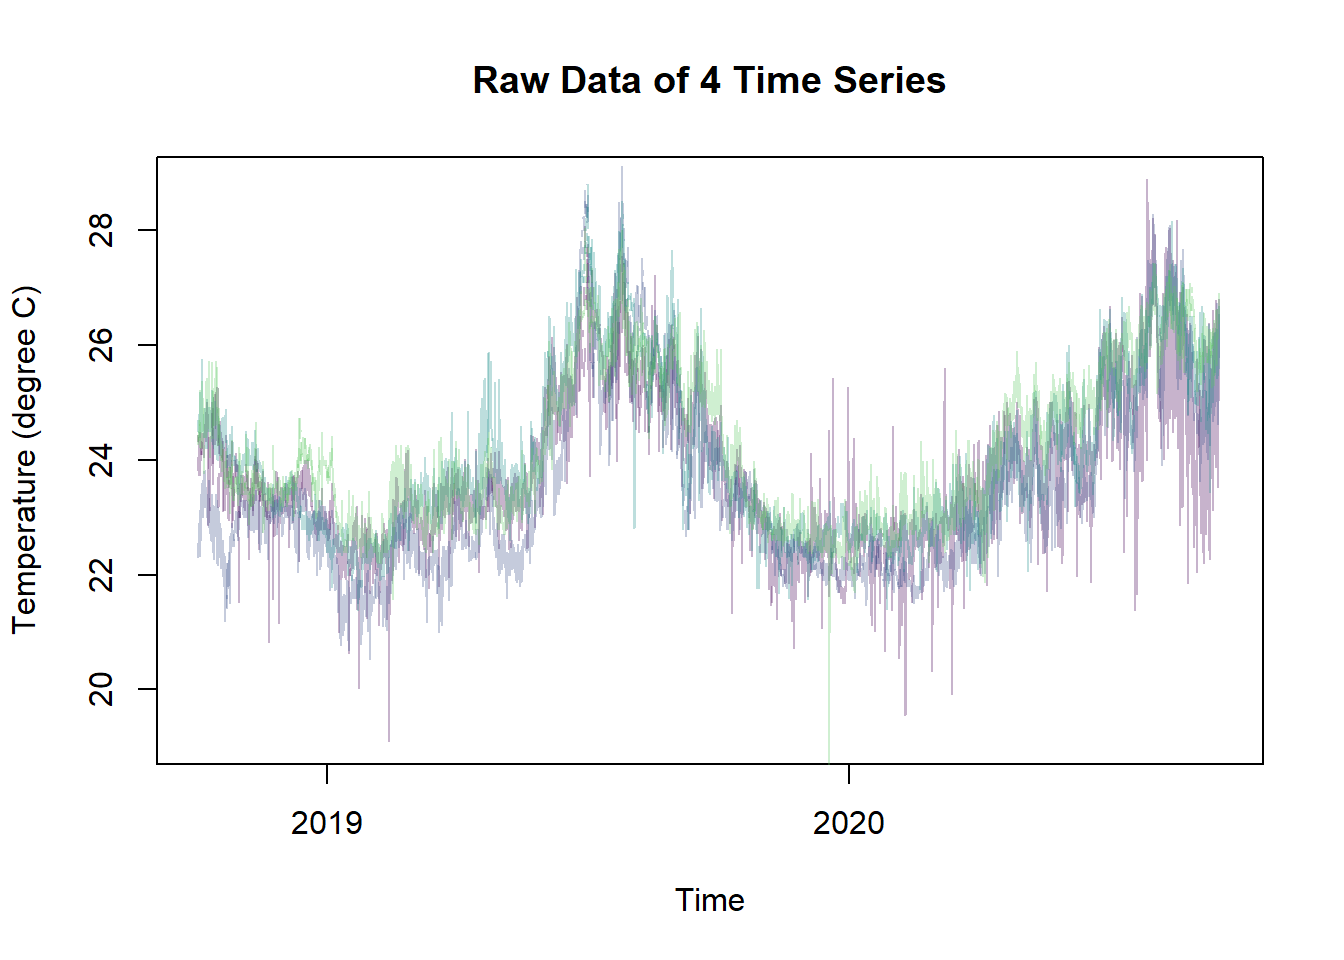
A csv file with room temperature and humidity time series of four rooms. Below are only the room temperatures visualized.

Figure 9.2: Room Temperature Raw Data for Boxplot
9.1.3 Solution
Create a new script, copy/paste the following code and run it:
library(ggplot2)
library(plotly)
library(dplyr)
library(tidyr)
library(redutils)
library(lubridate)
# load time series data and aggregate daily mean values
df <- read.csv("https://github.com/hslu-ige-laes/edar/raw/master/sampleData/flatTempHum.csv",
                          stringsAsFactors=FALSE,
                          sep =";")

df$time <- parse_date_time(df$time,
                           order = "YmdHMS",
                           tz = "Europe/Zurich")

df <- df %>%
  select(time, FlatA_Temp, FlatB_Temp, FlatC_Temp, FlatD_Temp)

df <- as.data.frame(tidyr::pivot_longer(df,
                                        cols = -time,
                                        names_to = "room",
                                        values_to = "Temp",
                                        values_drop_na = TRUE))

minY <- round(min(df %>% select(Temp), na.rm = TRUE) - 1, digits = 0)
maxY <- round(max(df %>% select(Temp), na.rm = TRUE) + 1, digits = 0)


plot <- ggplot(df, aes(x = room, y = Temp)) +
  geom_boxplot(outlier.alpha = 0.01, outlier.shape = 1, outlier.colour = "darkgrey") +
  scale_y_continuous(limits=c(minY,maxY), breaks = seq(minY, maxY, by = 2)) +
  ggtitle("Boxplot per Flat/Room") +
  theme_minimal() +
  theme(
    legend.position="none",
    plot.title = element_text(hjust = 0.5)
  )

yaxis <- list(
  title = "Temp<sub>Room</sub> in \u00B0C\n",
  automargin = TRUE,
  titlefont = list(size = 14, color = "darkgrey")
)

# create interactive plot
ggplotly(plot + ylab(" ") + xlab(" ")) %>%
  plotly::config(modeBarButtons = list(list("toImage")),
                 displaylogo = FALSE,
                 toImageButtonOptions = list(
                   format = "svg"
                 )
  ) %>%
  layout(yaxis = yaxis)