12.2 Median-Weeks
12.2.1 Goal
Create an energy consumption heat map of a median week depending on the season of the year:
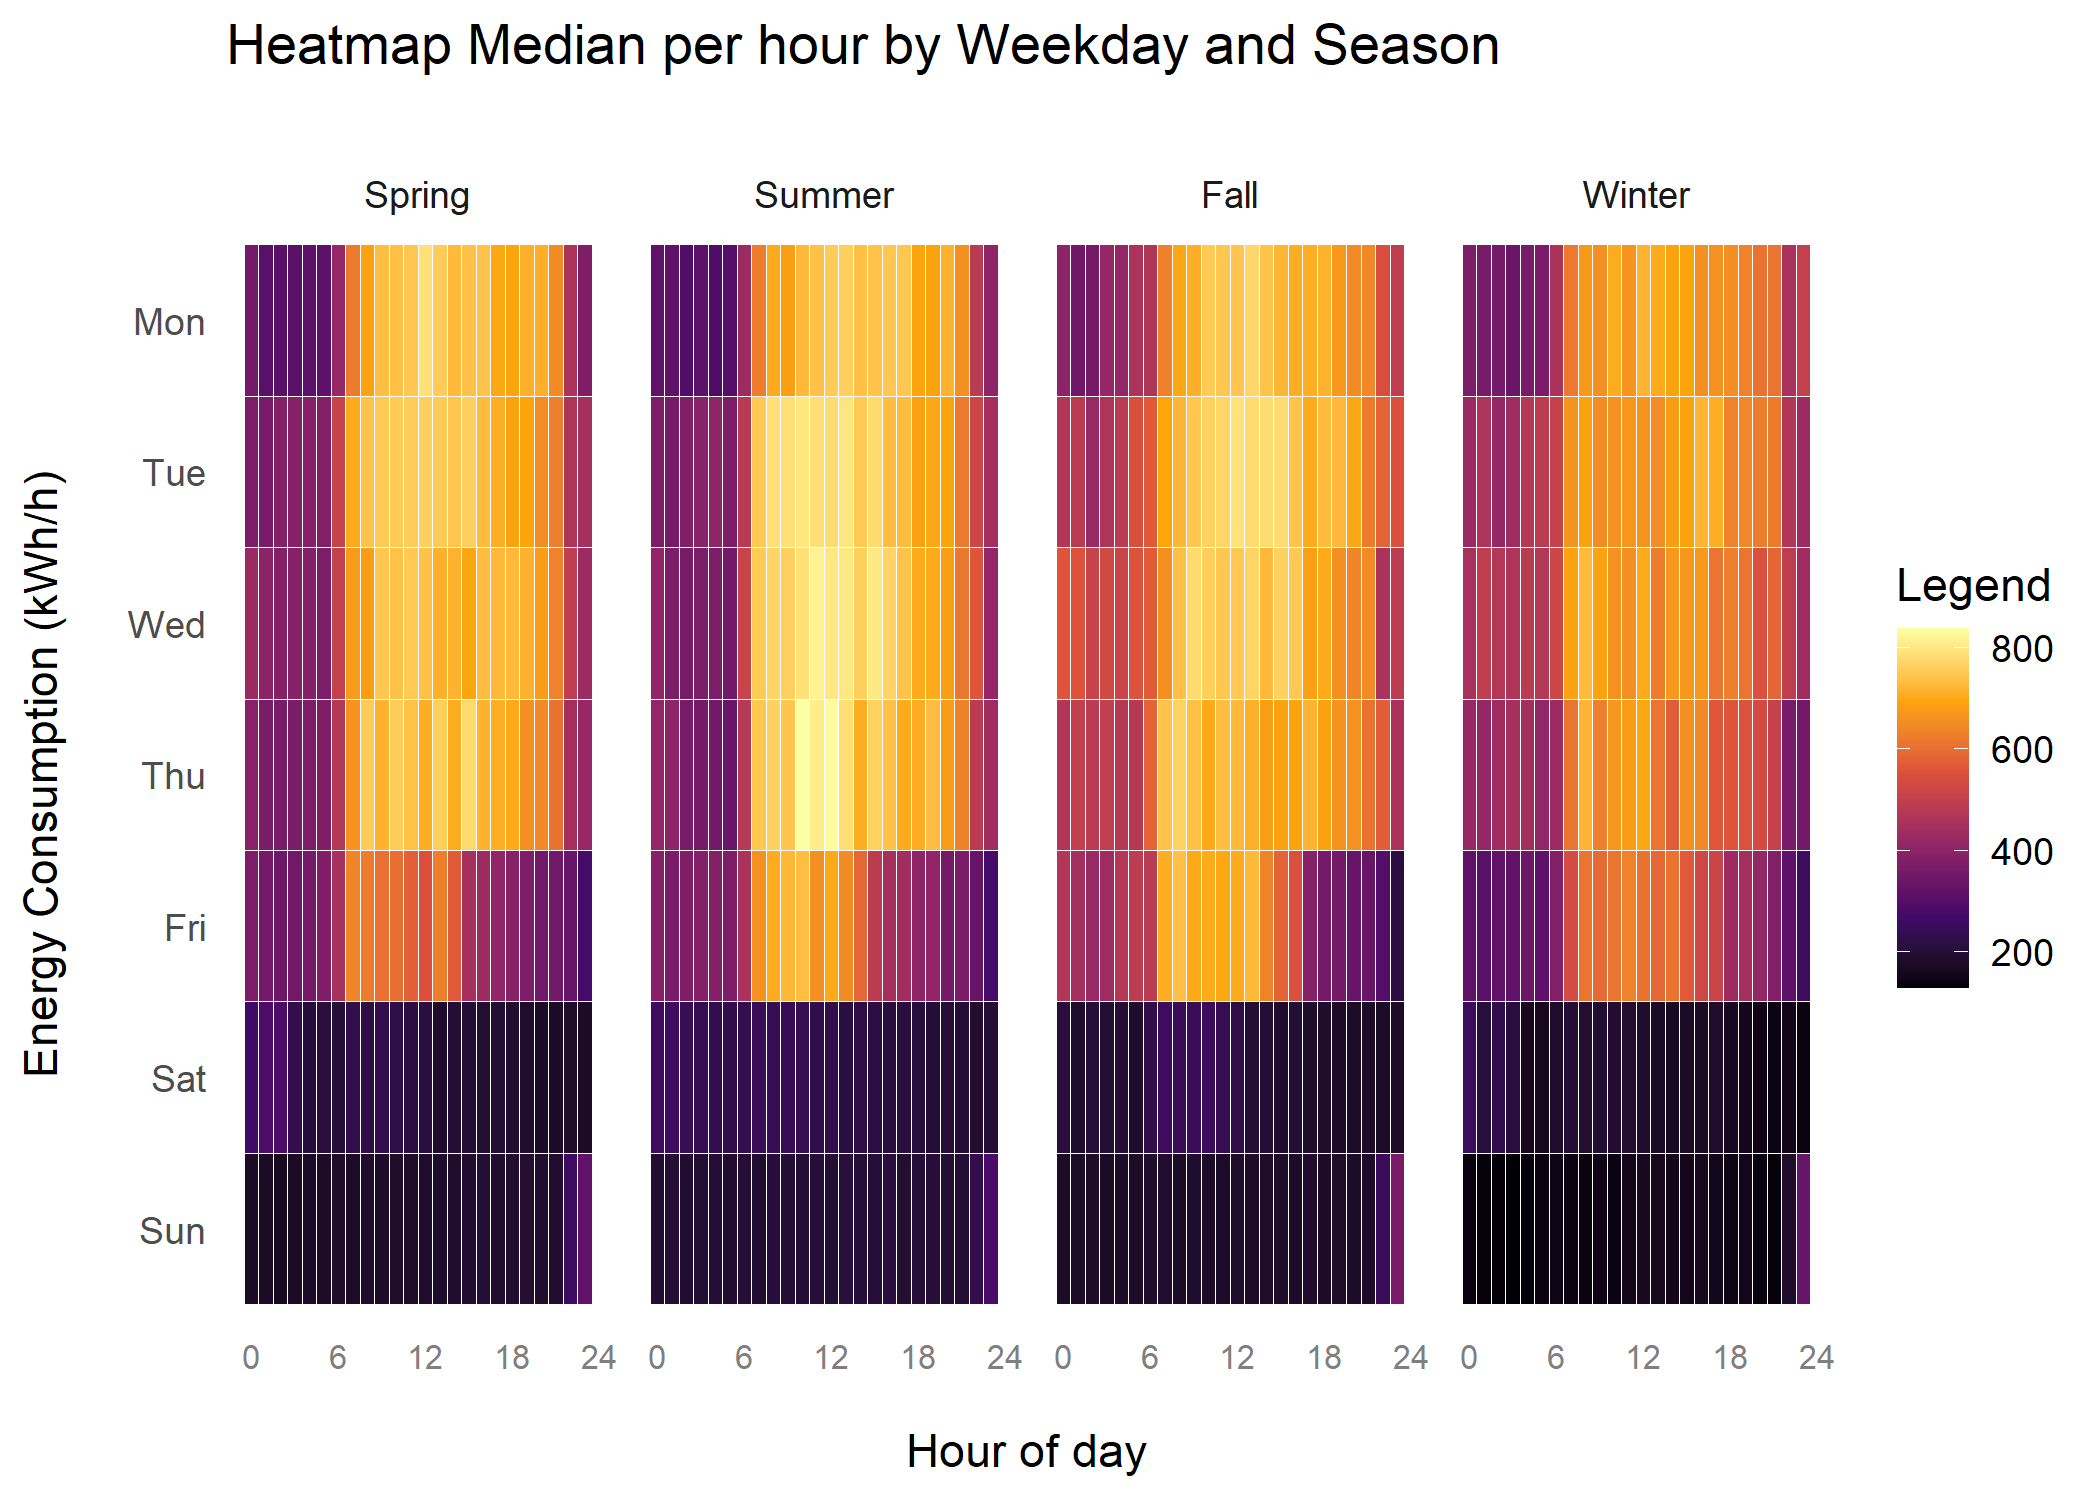
Figure 12.3: Heat Map of Median Weeks per Season of Year
12.2.2 Data Basis
Daily energy consumption values of one whole year in an interval of 15mins.
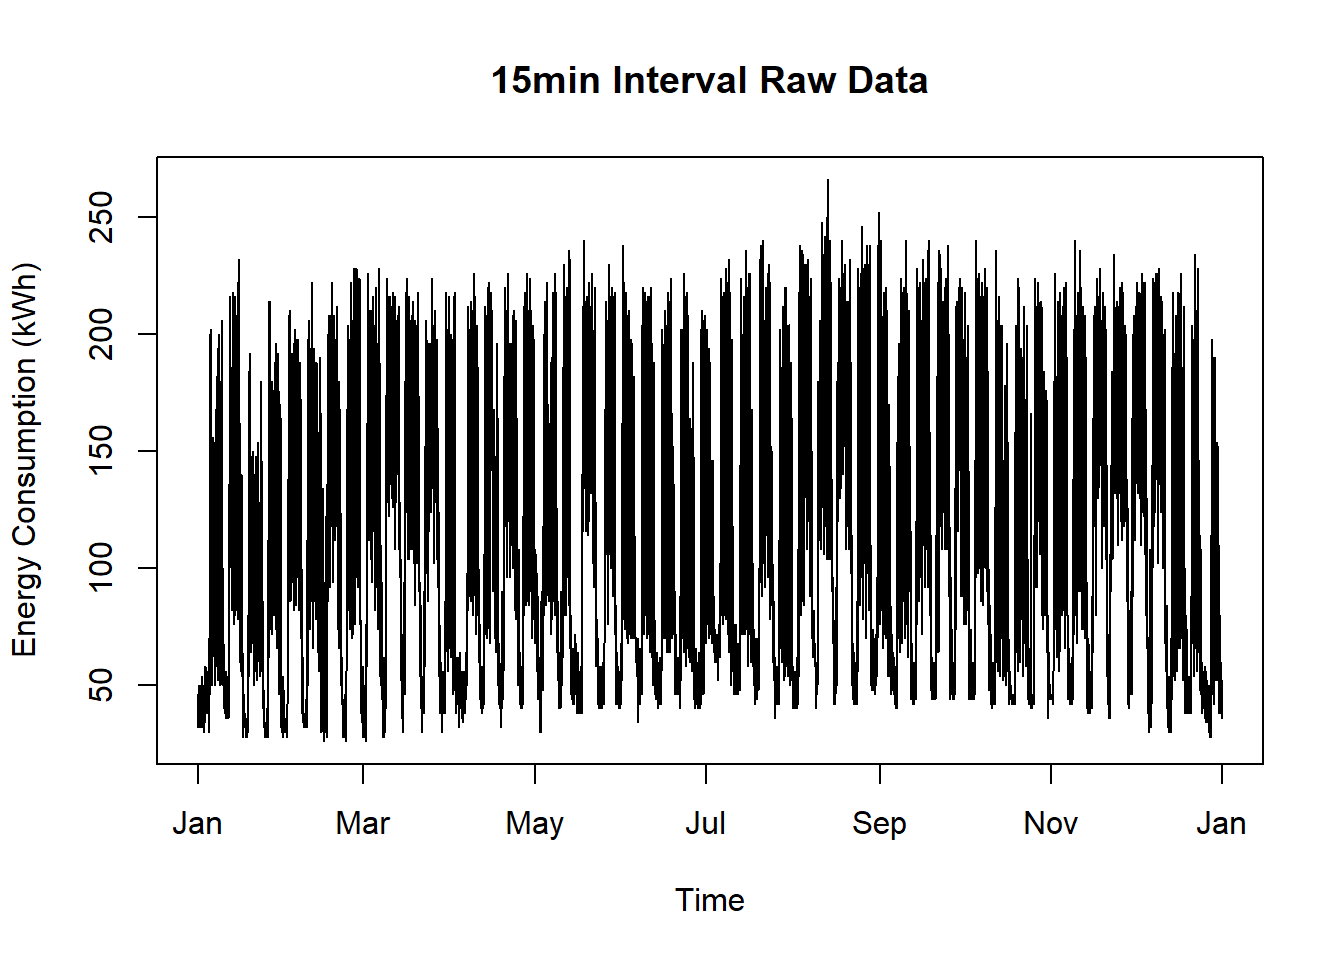
Figure 12.4: Raw Data for Decomposition Plot Short Term
12.2.3 Solution
Create a new script, copy/paste the following code and run it:
library(redutils)
library(plotly)

data <- readRDS(system.file("sampleData/eboBookEleMeter.rds", package = "redutils"))
plot <- plotHeatmapMedianWeeks(data, locTimeZone = "Europe/Zurich")

# show the static plot
plot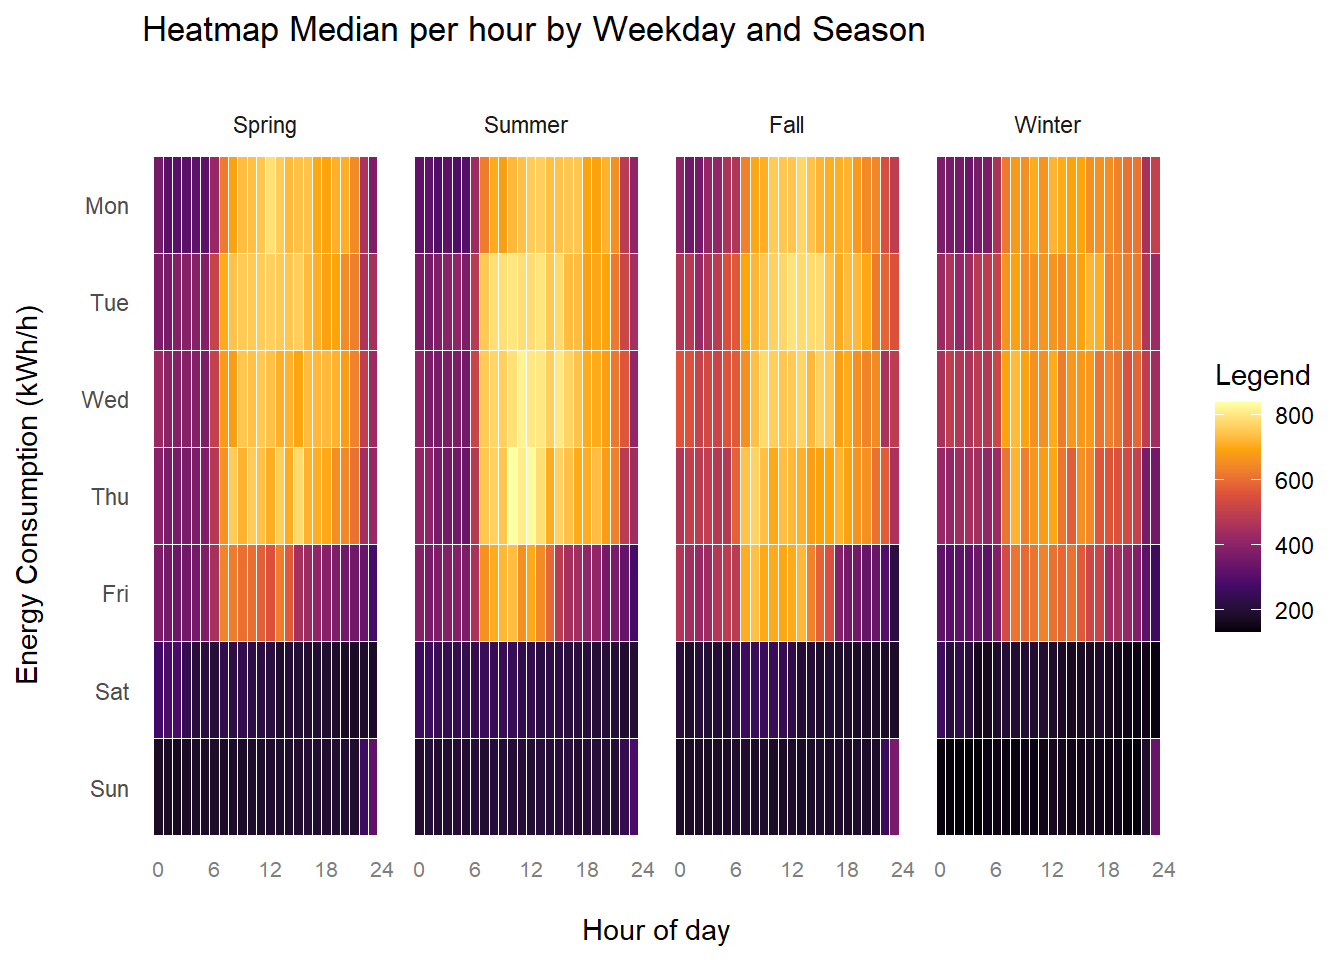
12.2.4 Discussion
Some findings:
Increased consumption at midnight, but not visible in Summer, probably heating affected
Clearly less consumption at weekends, starting already friday afternoon
High peaks on Tuesdays and Thursdays in summer