12.1 Calendar
12.1.1 Goal
Create a calendar heat map with daily energy consumption values:
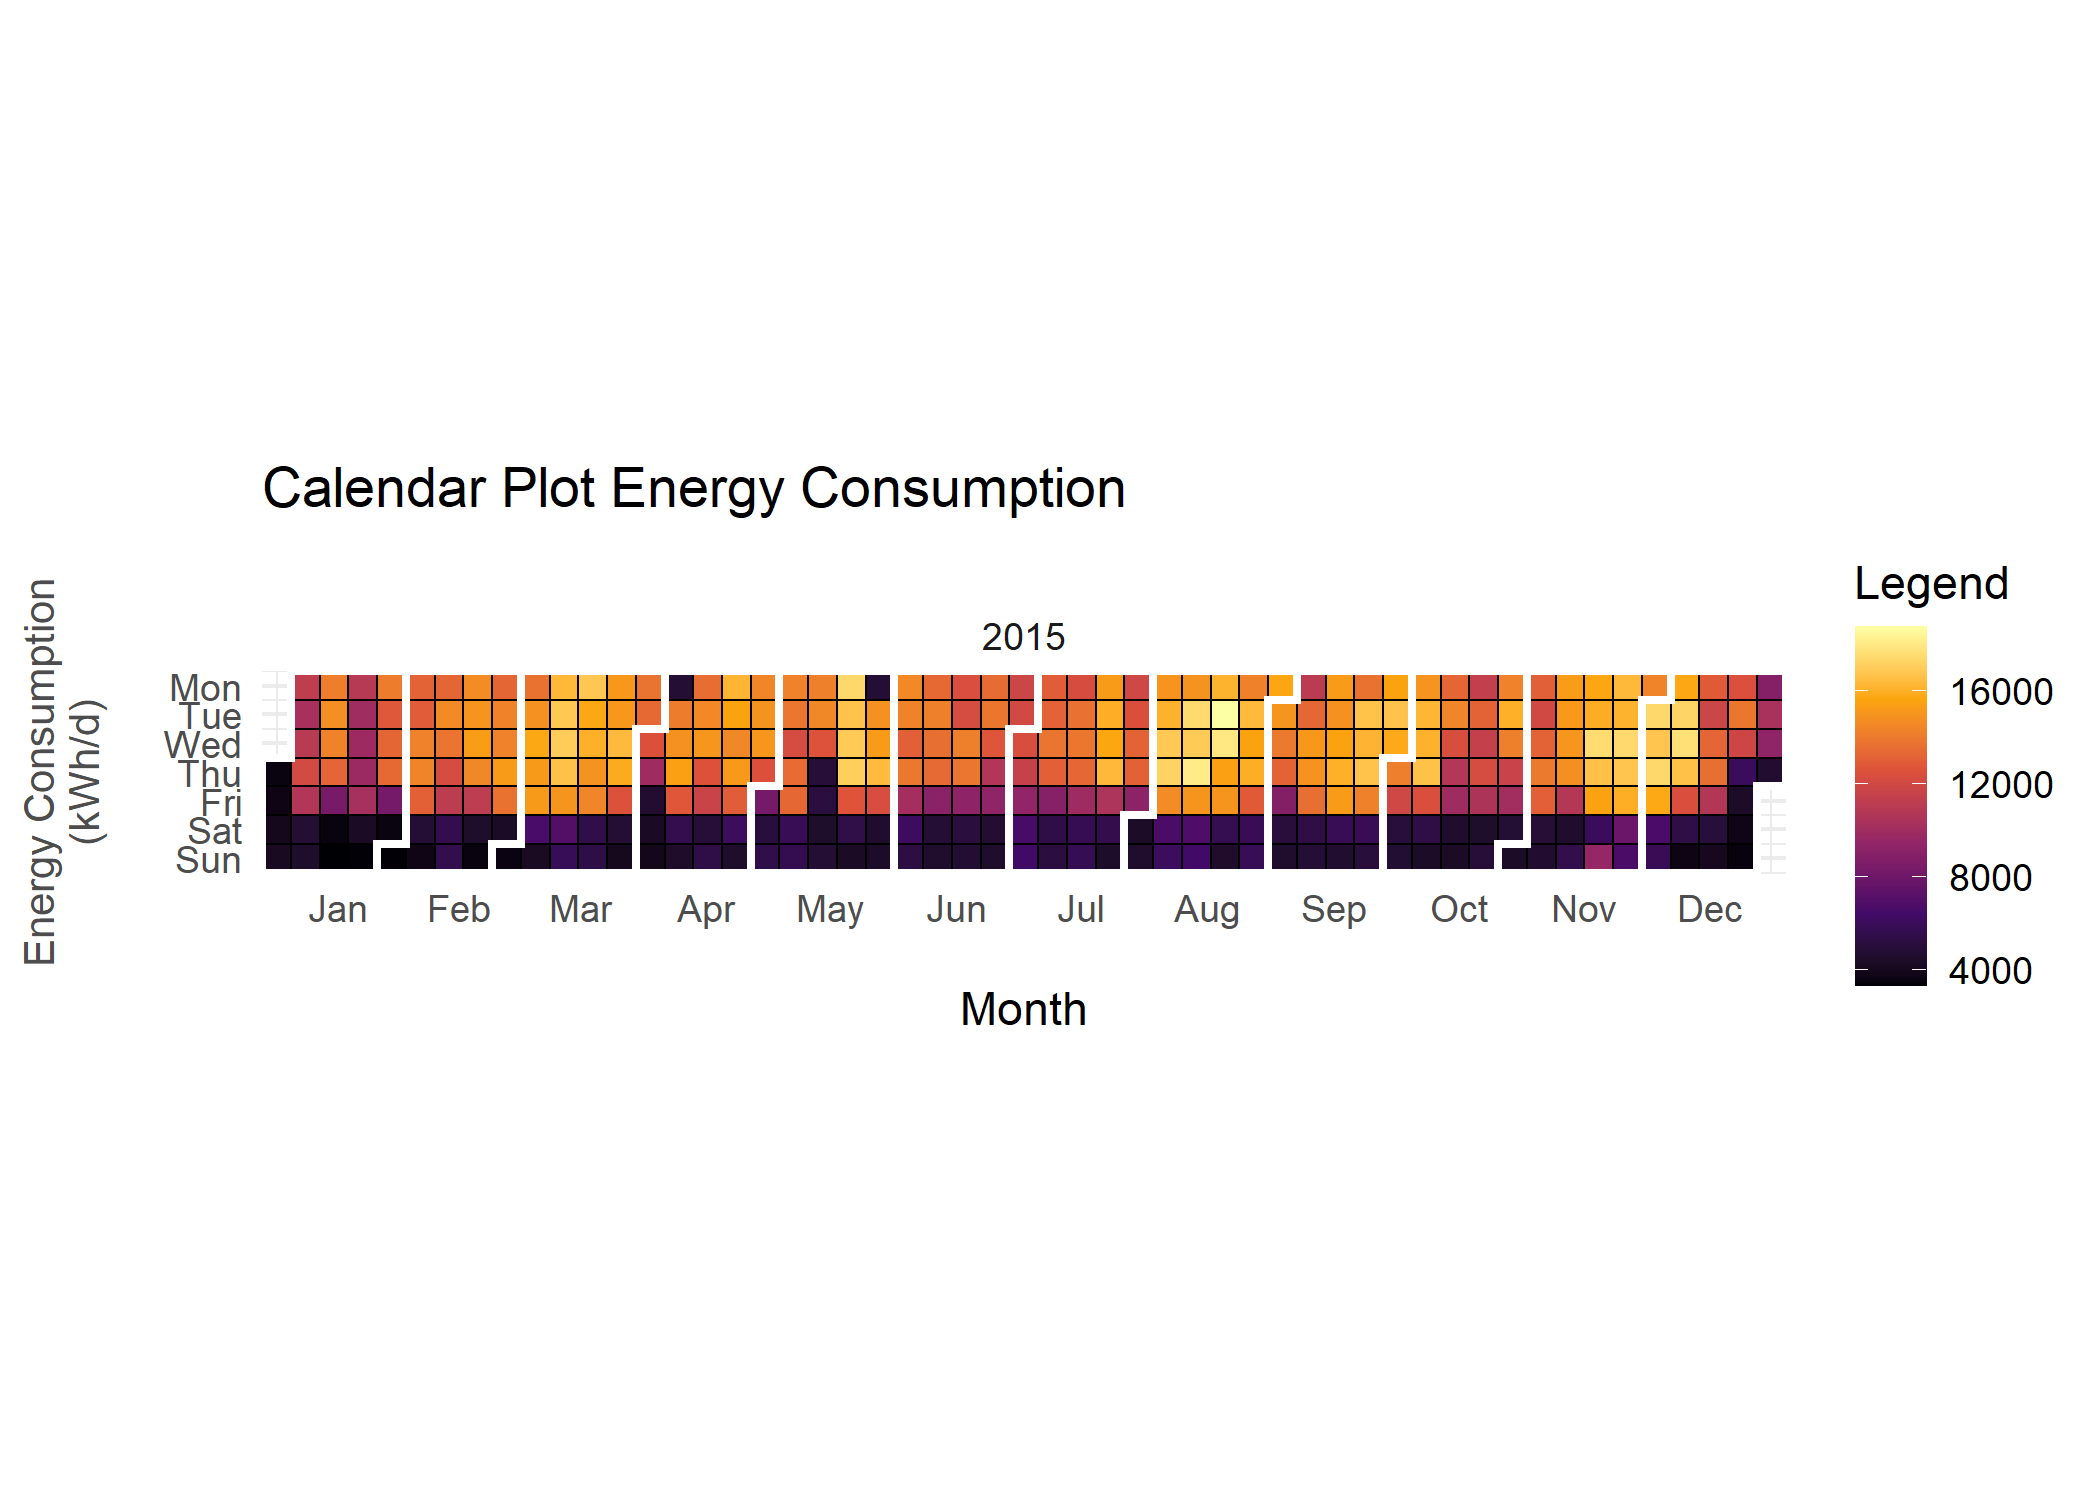
Figure 12.1: Calendar Heat Map
12.1.2 Data Basis
Daily energy consumption values of one whole year in an interval of 15mins.
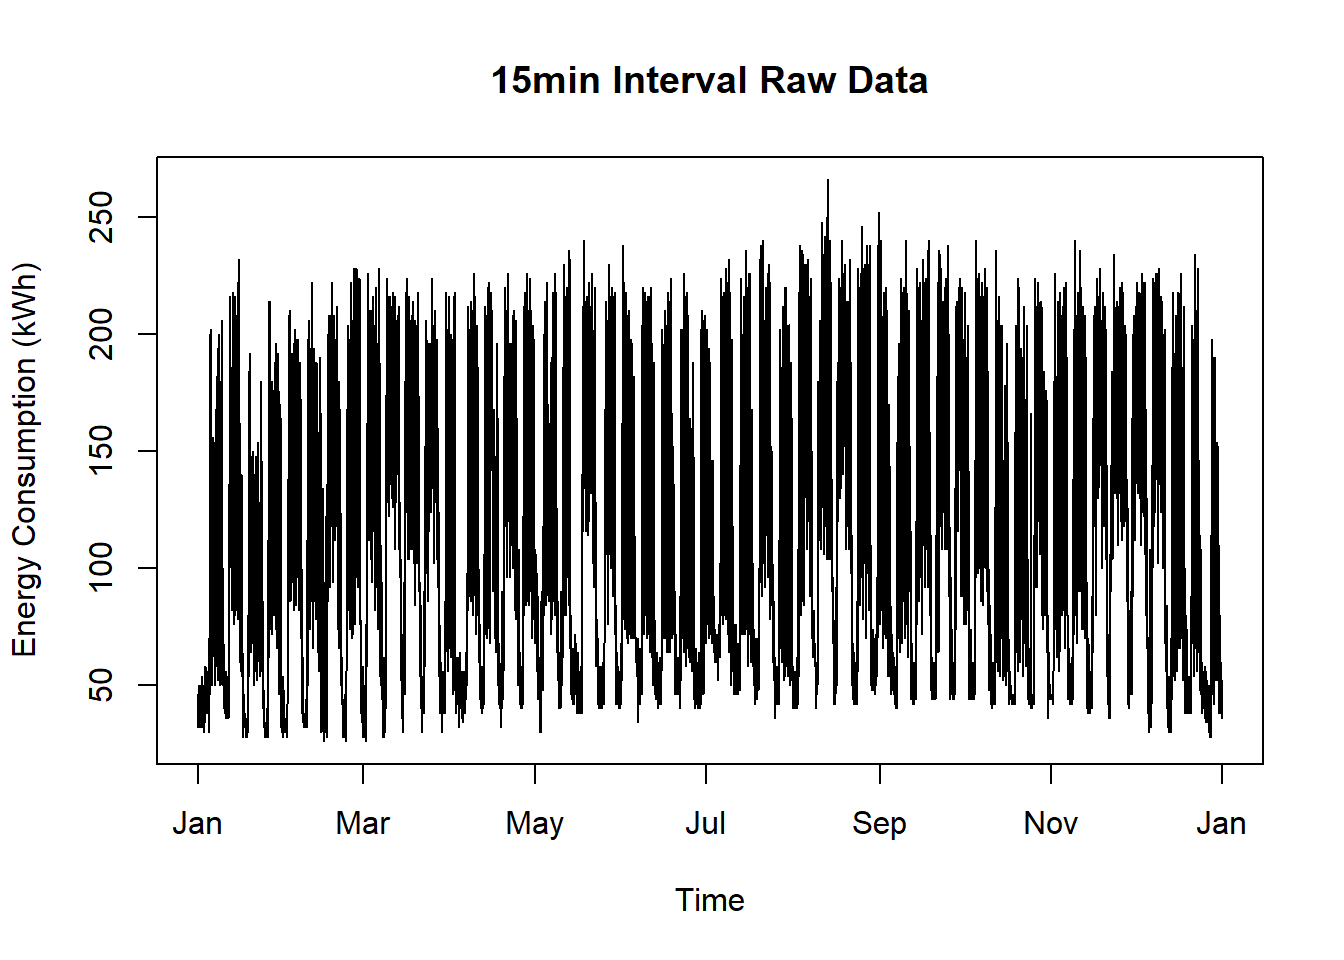
Figure 12.2: Raw Data for Decomposition Plot Short Term
12.1.3 Solution
Create a new script, copy/paste the following code and run it:
library(ggplot2)
library(ggTimeSeries)
library(plotly)
library(lubridate)
library(dplyr)
library(tidyquant)

data <- readRDS(system.file("sampleData/eboBookEleMeter.rds", package = "redutils"))

data <- data[-nrow(data),]

data$timestamp <- parse_date_time(data$timestamp,
                                      order = "YmdHMS",
                                      tz = "UTC")

data$day <- as.Date(lubridate::floor_date(data$timestamp,"day"))

data <- data %>%
  select(-timestamp)

data.plot <- data %>%
  dplyr::group_by(day) %>%
  dplyr::mutate(calcVal = sum(value, na.rm = TRUE)) %>%
  ungroup() %>%
  select(-value) %>%
  unique()

plot <- ggplot_calendar_heatmap(data.plot,
                             "day",
                             "calcVal",
                             monthBorderSize = 1,
                             monthBorderColour = "white",
                             monthBorderLineEnd = "square") +
  scale_fill_viridis_c(option = "B") +
  theme_minimal() +
  theme(axis.title.y = element_text(colour = "grey30", size = 10, face = "plain"),
                   )+
  labs(x = "\nMonth",
       y = "Energy Consumption\n(kWh/d)\n ",
       fill = "Legend") +
  facet_wrap(~Year, ncol = 1) +
  ggtitle("Calendar Plot Energy Consumption\n")

plot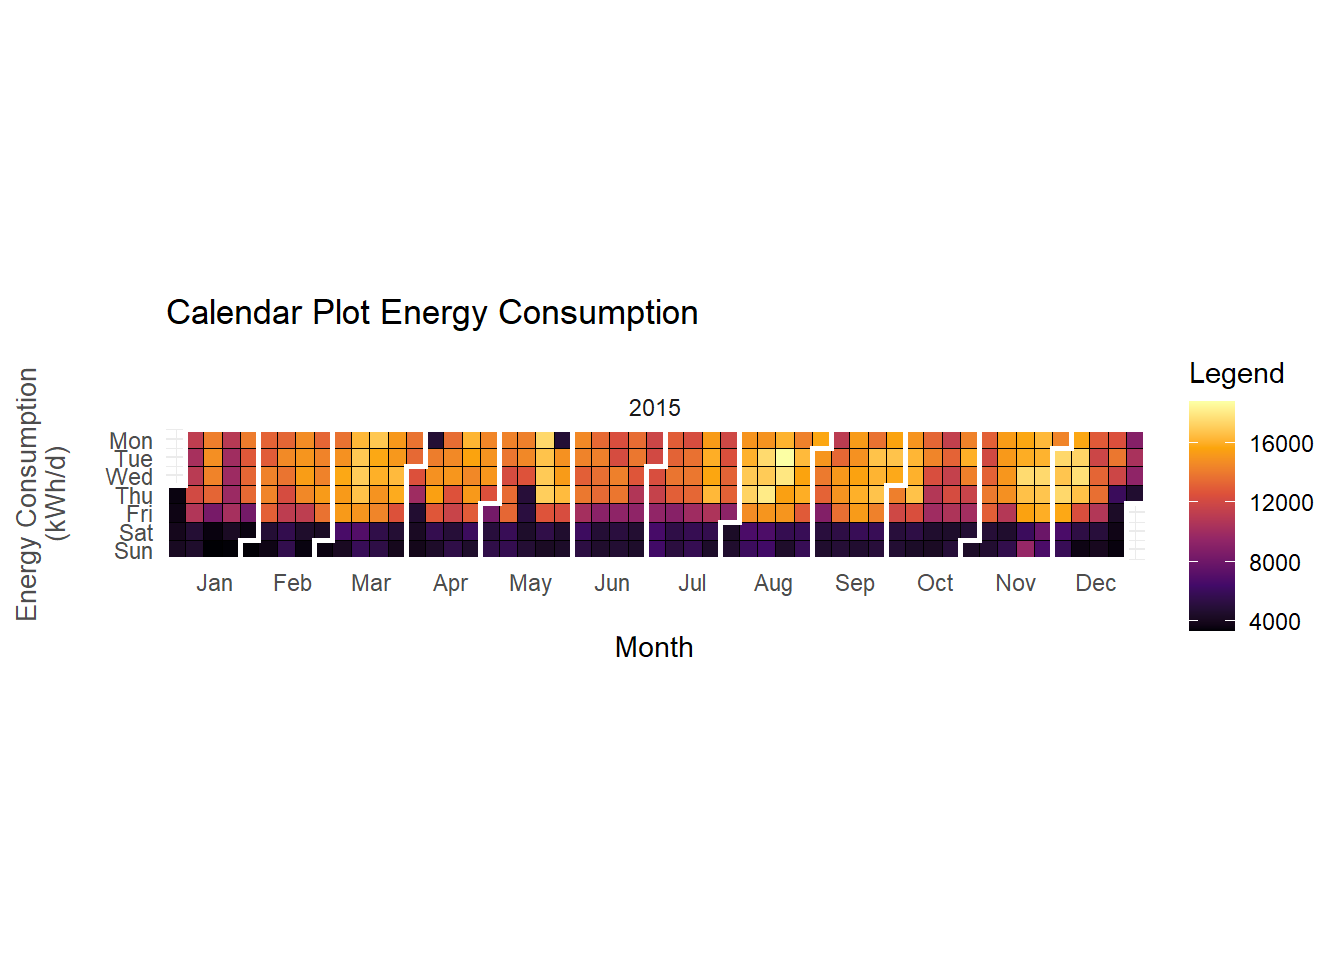
12.1.4 Discussion
Some findings:
first two days in year minimal consumption
6th of April: Easter Monday
25th of May: Whitmonday (de: Pfingstmontag)
More usage in August
In November one Sunday with unusual high consumption
On Fridays in general less consumption