16.2 Room Temperature Reduction
16.2.1 Goal
As part of an energy optimization, you lower the room temperatures in a room and would now like to show the reduction effect using the time series of the room temperature sensor. In the example below you make two optimizations at different dates.
You want to create a time series plot with:
the daily median, min and max value
the overall median of each period
the desired setpoint
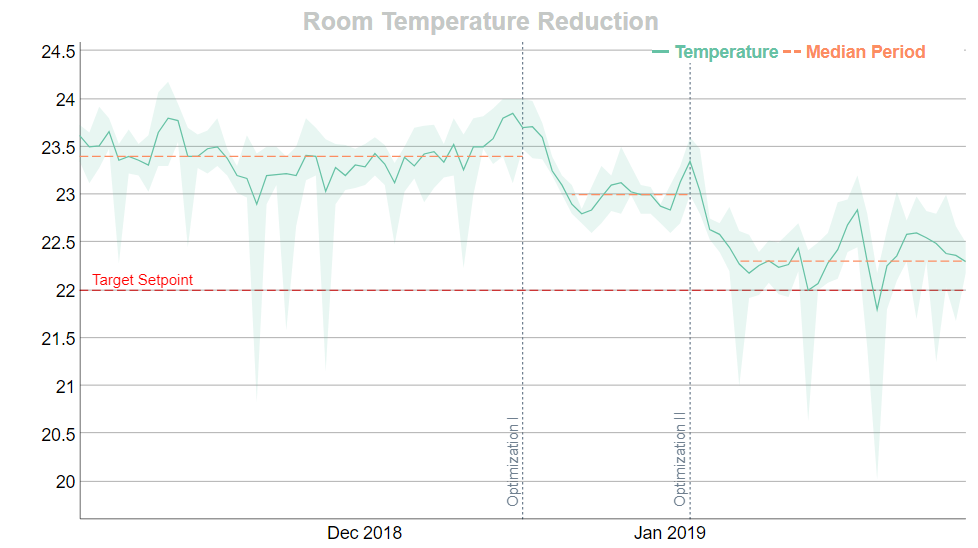
Figure 16.3: Room Temperature Reduction Plot
16.2.2 Data Basis
- Time series data from e.g. a temperature sensor with unaligned time intervals
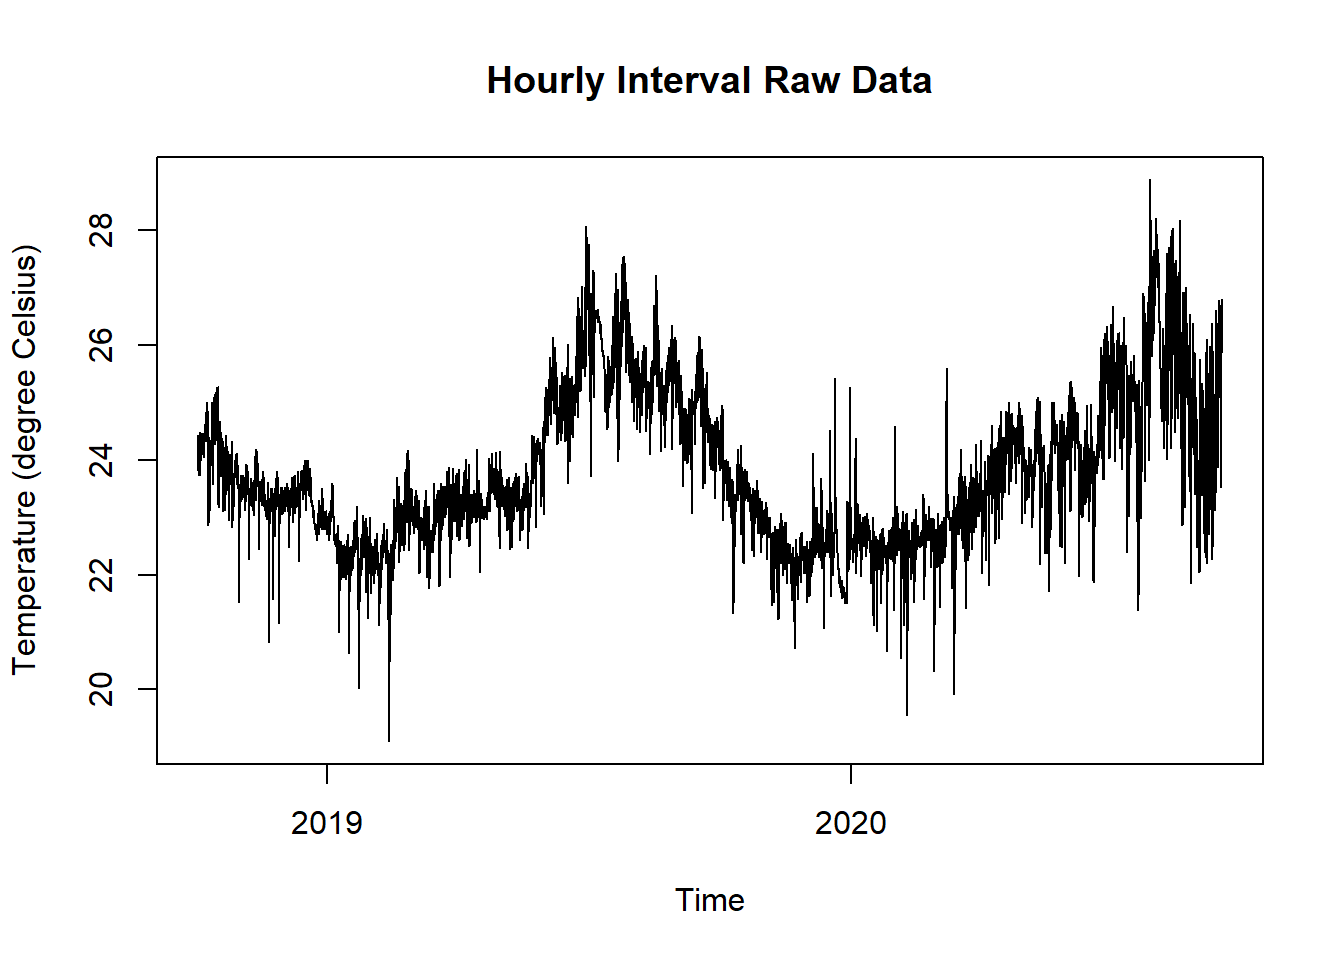
Figure 16.4: Raw Data Temperature for Room Temperature Reduction Plot
16.2.3 Solution
Create a new script, copy/paste the following code and run it:
library(dplyr)
library(lubridate)
library(dygraphs)
library(xts)
library(redutils)
library(RColorBrewer)

# Settings
tempSetpoint = 22.0

startDate = "2018-11-01"
endDate = "2019-02-01"

optiDate1 = "2018-12-17"
optiLabel1 = "Optimization I"

optiDate2 = "2019-01-03"
optiLabel2 = "Optimization II"

optiDelayDays = 5

# read and print data
df <- read.csv("https://github.com/hslu-ige-laes/edar/raw/master/sampleData/flatTempHum.csv",
                 stringsAsFactors=FALSE,
                 sep =";")

# select temperature and remove empty cells
df <- df %>% select(time, FlatA_Temp) %>% na.omit()

# create column with day for later grouping
df$time <- parse_date_time(df$time, "YmdHMS", tz = "Europe/Zurich")
df$day <- as.Date(cut(df$time, breaks = "day"))
df$day <- as.Date(as.character(df$day,"%Y-%m-%d"))

# filter time range
df <- df %>% filter(day > startDate, day < endDate)

# calculate daily median, min and max of temperature
df <- df %>%
  group_by(day) %>%
  dplyr::mutate(minDay = min(as.numeric(FlatA_Temp)),
                medianDay = median(as.numeric(FlatA_Temp)),
                maxDay = max(as.numeric(FlatA_Temp))
         ) %>%
  ungroup()

# shrink down to daily values and remove rows with empty values
df <- df %>% select(day, medianDay, minDay, maxDay) %>% unique() %>% na.omit()

# calculate medians for time ranges
df <- df %>%
  dplyr::mutate(period = ifelse(day >= startDate & day <= optiDate1,
                                "Baseline",
                                 ifelse((day >= (as.Date(optiDate1) + optiDelayDays))
                                        & (day <= optiDate2),
                                        "Opti1",
                                        ifelse((day >= (as.Date(optiDate2) + optiDelayDays))
                                        & (day <= endDate),
                                        "Opti2",
                                        NA)
                                 )))

df <- df %>%
  group_by(period) %>%
  dplyr::mutate(medianPeriod = ifelse(is.na(period), NA, median(medianDay))) %>%
  ungroup() %>%
  select(-period)

# create xts object for plotting
plotdata <- xts( x=df[,-1], order.by=df$day)

# plot graph
dygraph(plotdata, main = "Room Temperature Reduction") %>%
  dyAxis("x", drawGrid = FALSE) %>%
  dySeries(c("minDay", "medianDay", "maxDay"),
           label = "Temperature") %>%
  dySeries(c("medianPeriod"),
           label = "Median Period",
           strokePattern = "dashed") %>%
  dyOptions(colors = RColorBrewer::brewer.pal(3, "Set2")) %>%
  dyEvent(x = optiDate1,
          label = optiLabel1,
          labelLoc = "bottom",
          color = "slategray",
          strokePattern = "dotted") %>%
  dyEvent(x = optiDate2,
          label = optiLabel2,
          labelLoc = "bottom",
          color = "slategray",
          strokePattern = "dotted") %>%
  dyLimit(tempSetpoint,
          color = "red",
          label = "Target Setpoint") %>%
  dyRangeSelector() %>%
  dyLegend(show = "always")
16.2.4 Discussion
In this example we used the dygraph package to create the graph. This package is fast and allows to show a rangeslider on the bottom of the graph. The exact same graph but without a slider is as well possible with ggplot.
Please note that the calculation of the periodic median after optimization I and II starts delayed because it takes time until the building has cooled down.