9.2 Cross-Correlation
9.2.1 Goal
You want to create a cross-correlation plot:
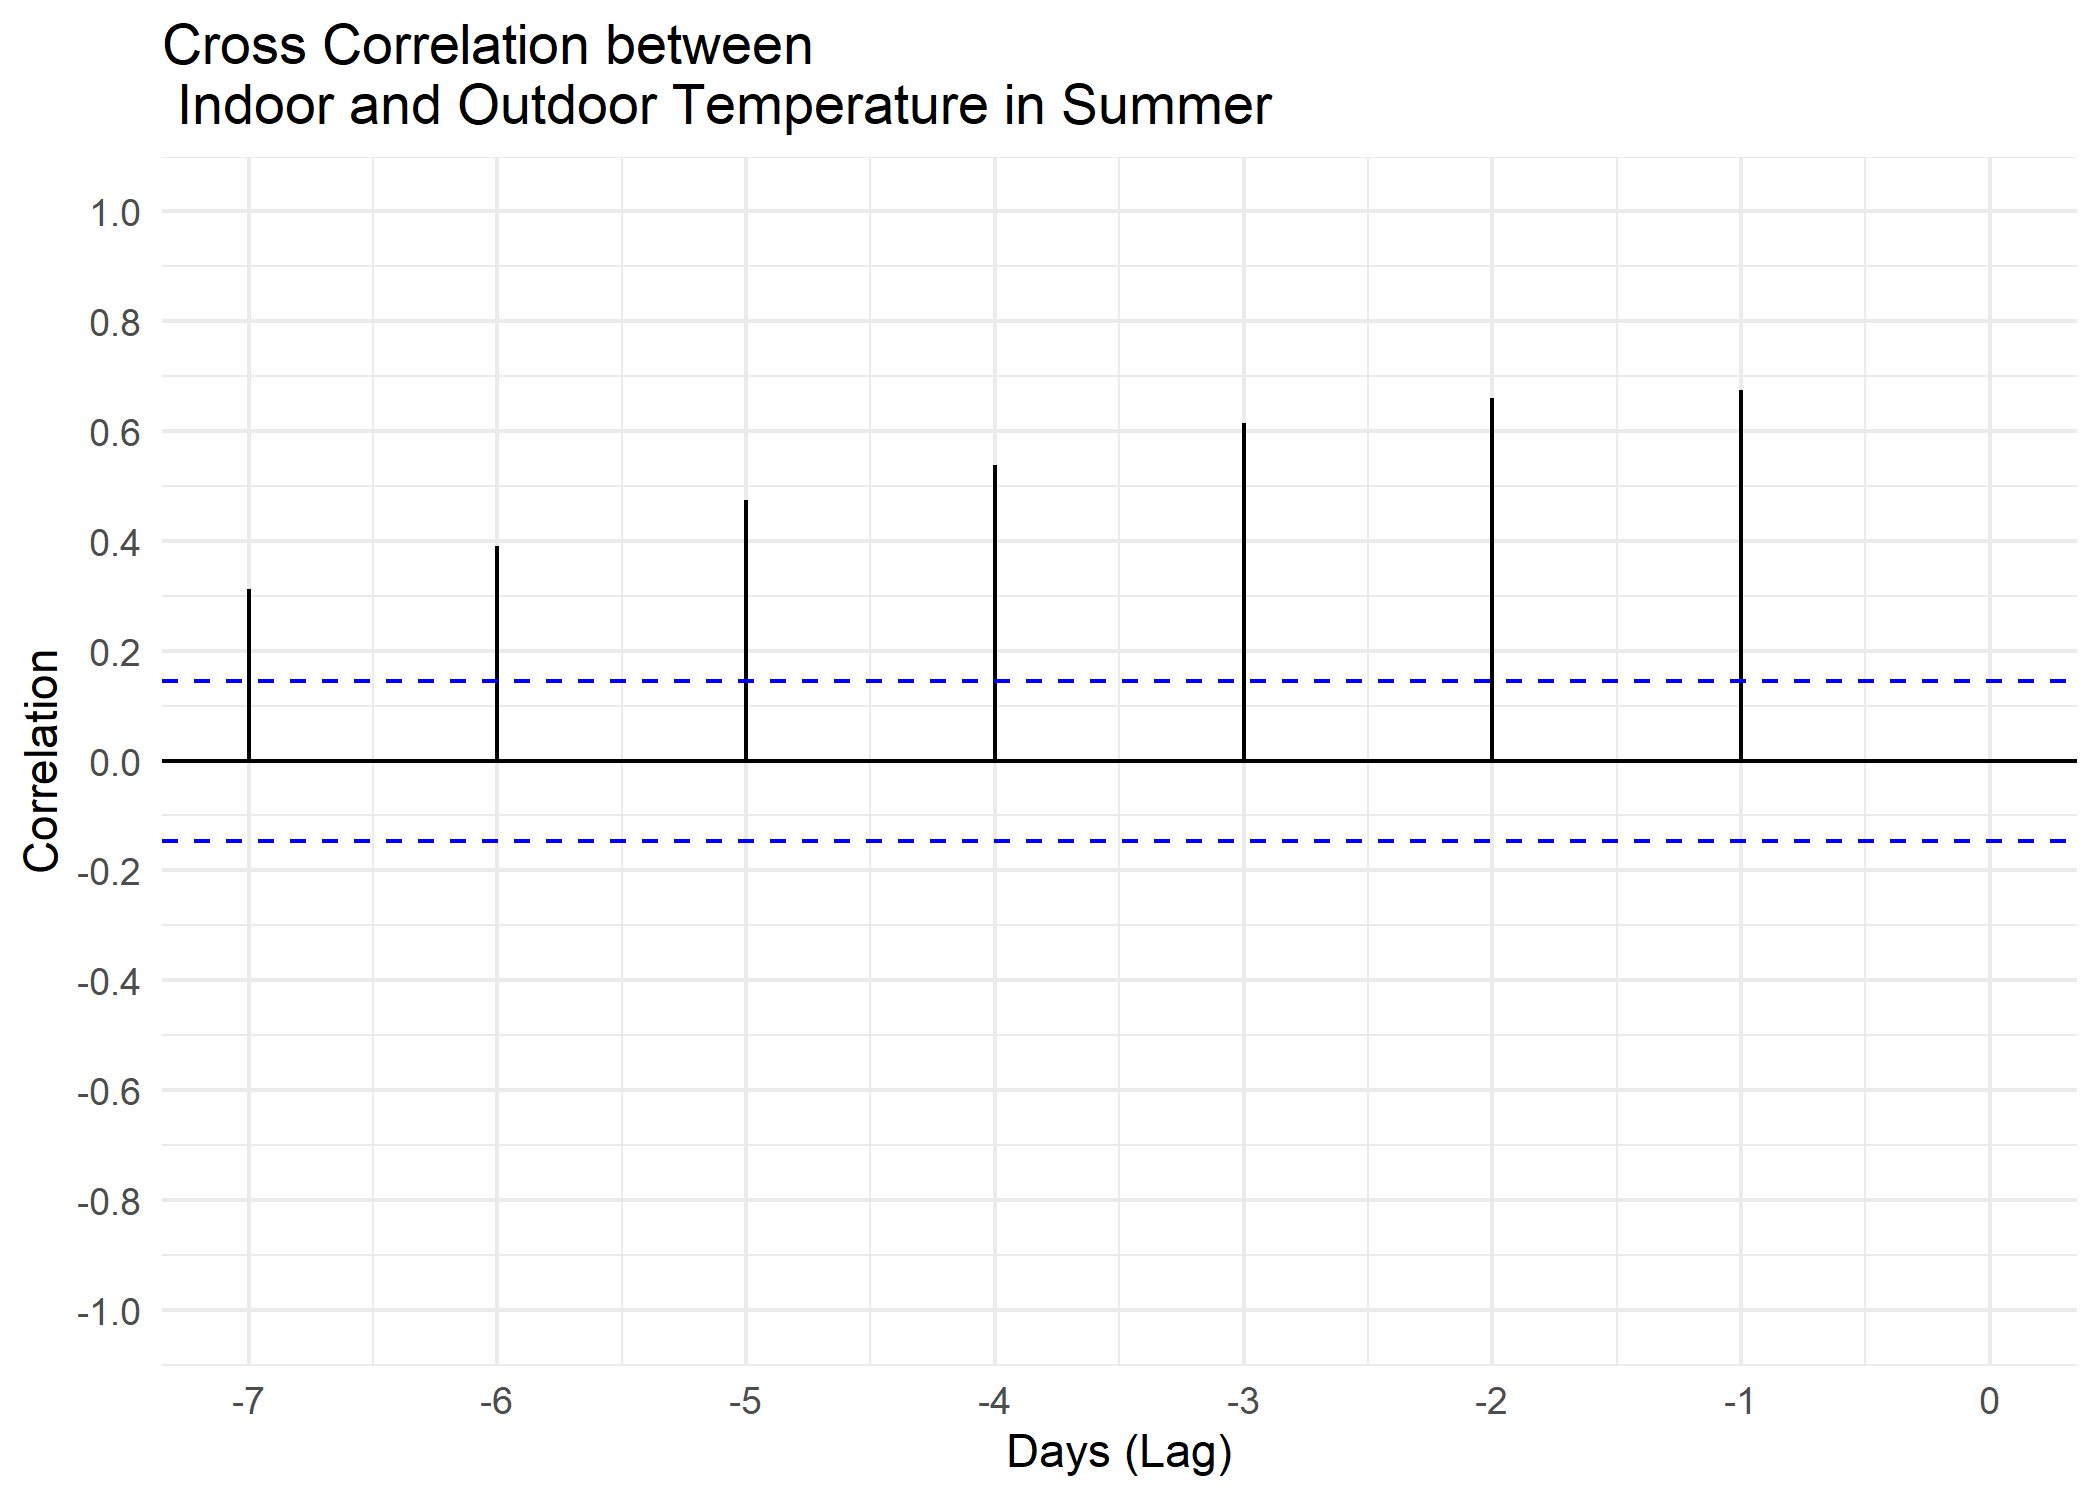
Figure 9.3: Building Energy Signature Plot
9.2.2 Data Basis
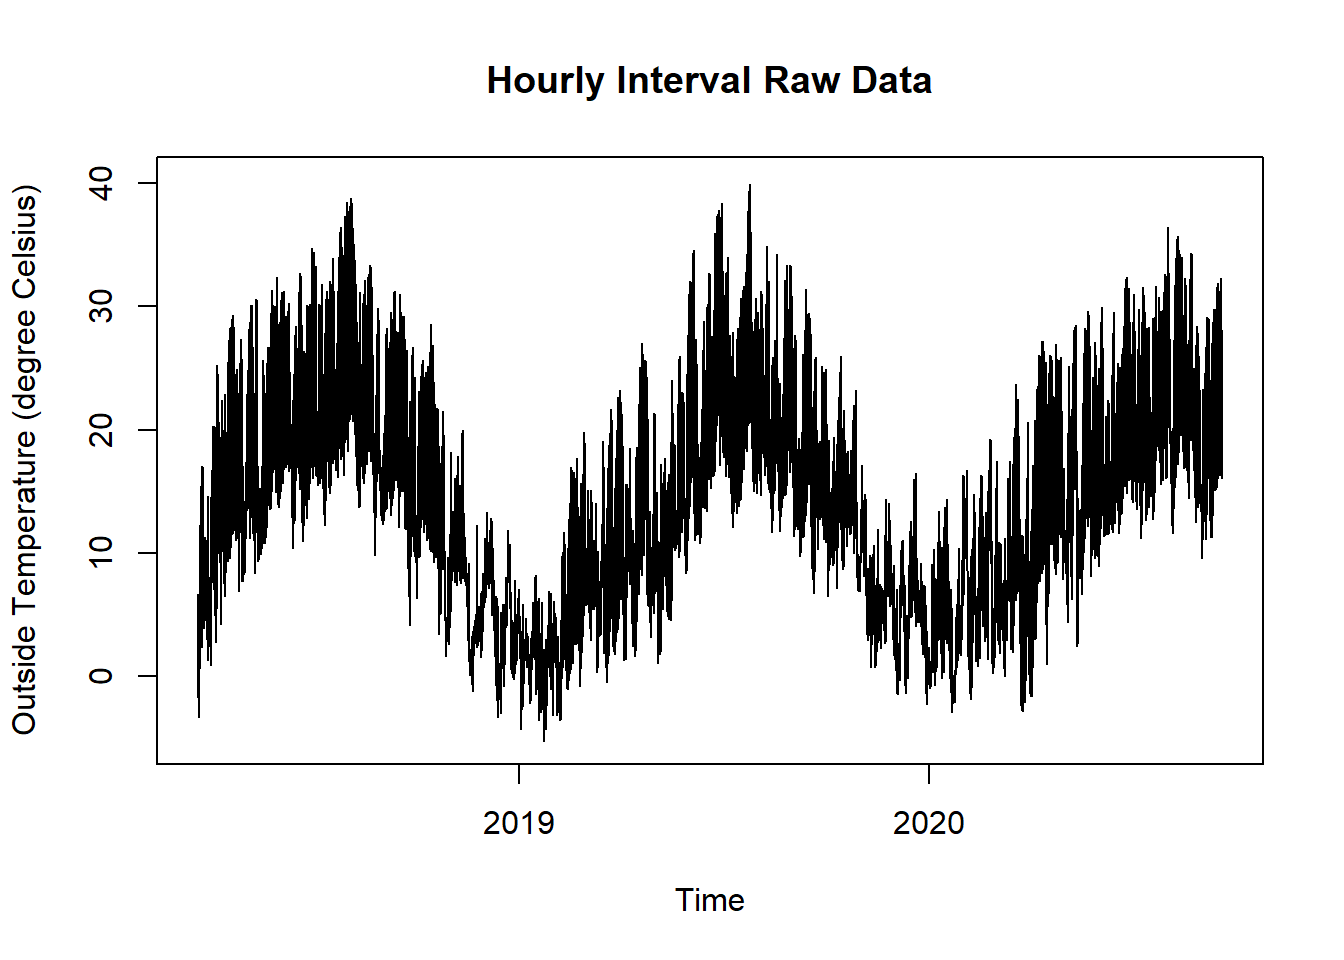
Figure 9.4: Raw Data Room and Outdoor Temperature for Cross Correlation Plot
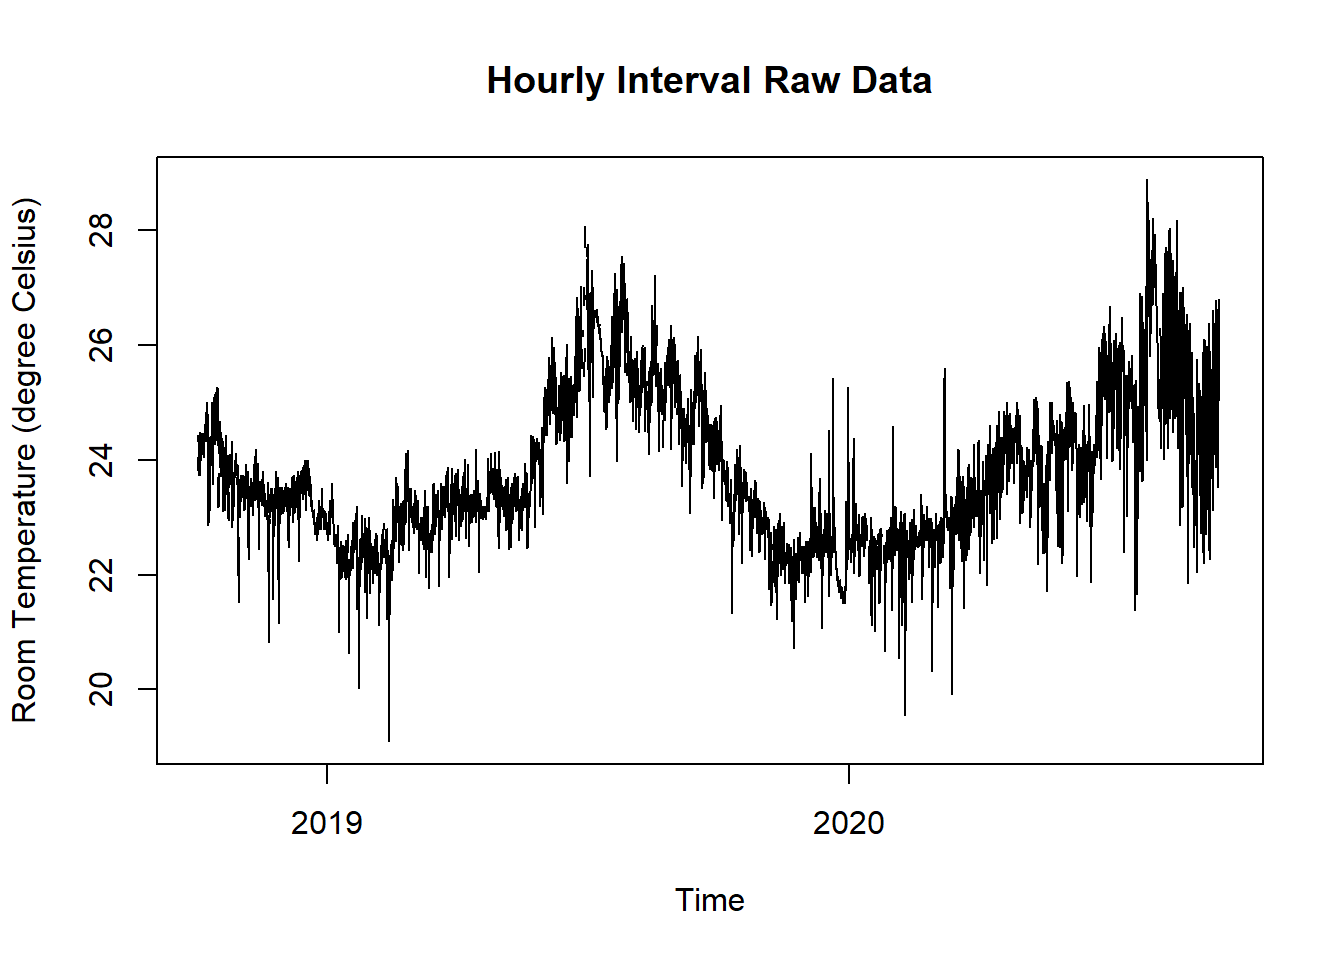
Figure 9.5: Raw Data Room and Outdoor Temperature for Cross Correlation Plot
9.2.3 Solution
Create a new script, copy/paste the following code and run it:
library(redutils)
library(dplyr)
library(lubridate)
library(zoo)
library(plotly)
library(forecast)

# load time series data and aggregate mean values
dfTempOa <- read.csv("https://github.com/hslu-ige-laes/edar/raw/master/sampleData/centralOutsideTemp.csv",
                          stringsAsFactors=FALSE,
                          sep =";")

dfTempOa$time <- parse_date_time(dfTempOa$time,
                                      order = "YmdHMS",
                                      tz = "UTC")

dfTempOa$day <- as.Date(cut(dfTempOa$time, breaks = "days"))

dfTempOa <- dfTempOa %>%
  group_by(day) %>%
  dplyr::summarize(tempOa = mean(centralOutsideTemp, na.rm = TRUE)) %>%
  ungroup()

dfTempR <- read.csv("https://github.com/hslu-ige-laes/edar/raw/master/sampleData/flatTempHum.csv",
                       stringsAsFactors=FALSE,
                       sep =";")

dfTempR$time <- parse_date_time(dfTempR$time,
                                   order = "YmdHMS",
                                   tz = "UTC")

# select temperature and humidity and remove empty cells
dfTempR <- dfTempR %>% select(time, FlatA_Temp) %>% na.omit()

dfTempR$day <- as.Date(cut(dfTempR$time, breaks = "days"))

dfTempR <- dfTempR %>%
  group_by(day) %>%
  dplyr::summarize(tempR = mean(FlatA_Temp, na.rm = TRUE)) %>%
  ungroup()

data <- merge(dfTempR, dfTempOa, all = TRUE) %>% unique() %>% na.omit()

data$season <- redutils::getSeason(data$day)

data <- data %>%
  filter(season == "Summer")

# plot diagram
plot <- ggCcf(data$tempOa,
              data$tempR,
              lag.max = 7) +
  theme_minimal() +
  scale_x_continuous(limits = c(-7, 0), breaks = seq(-7,0,1)) +
  scale_y_continuous(limits = c(-1, 1), breaks = seq(-1,1,0.2)) +
  labs(title="Cross Correlation between \n Indoor and Outdoor Temperature in Summer",
        x ="Days (Lag)", y = "Correlation")

# make plot interactive (optional)
ggplotly(plot)