11.2 Mini Plots
11.2.1 Goal
Plot a seasonal month plot as described in Hyndman and Athanasopoulos (2014, chapter 2.5):
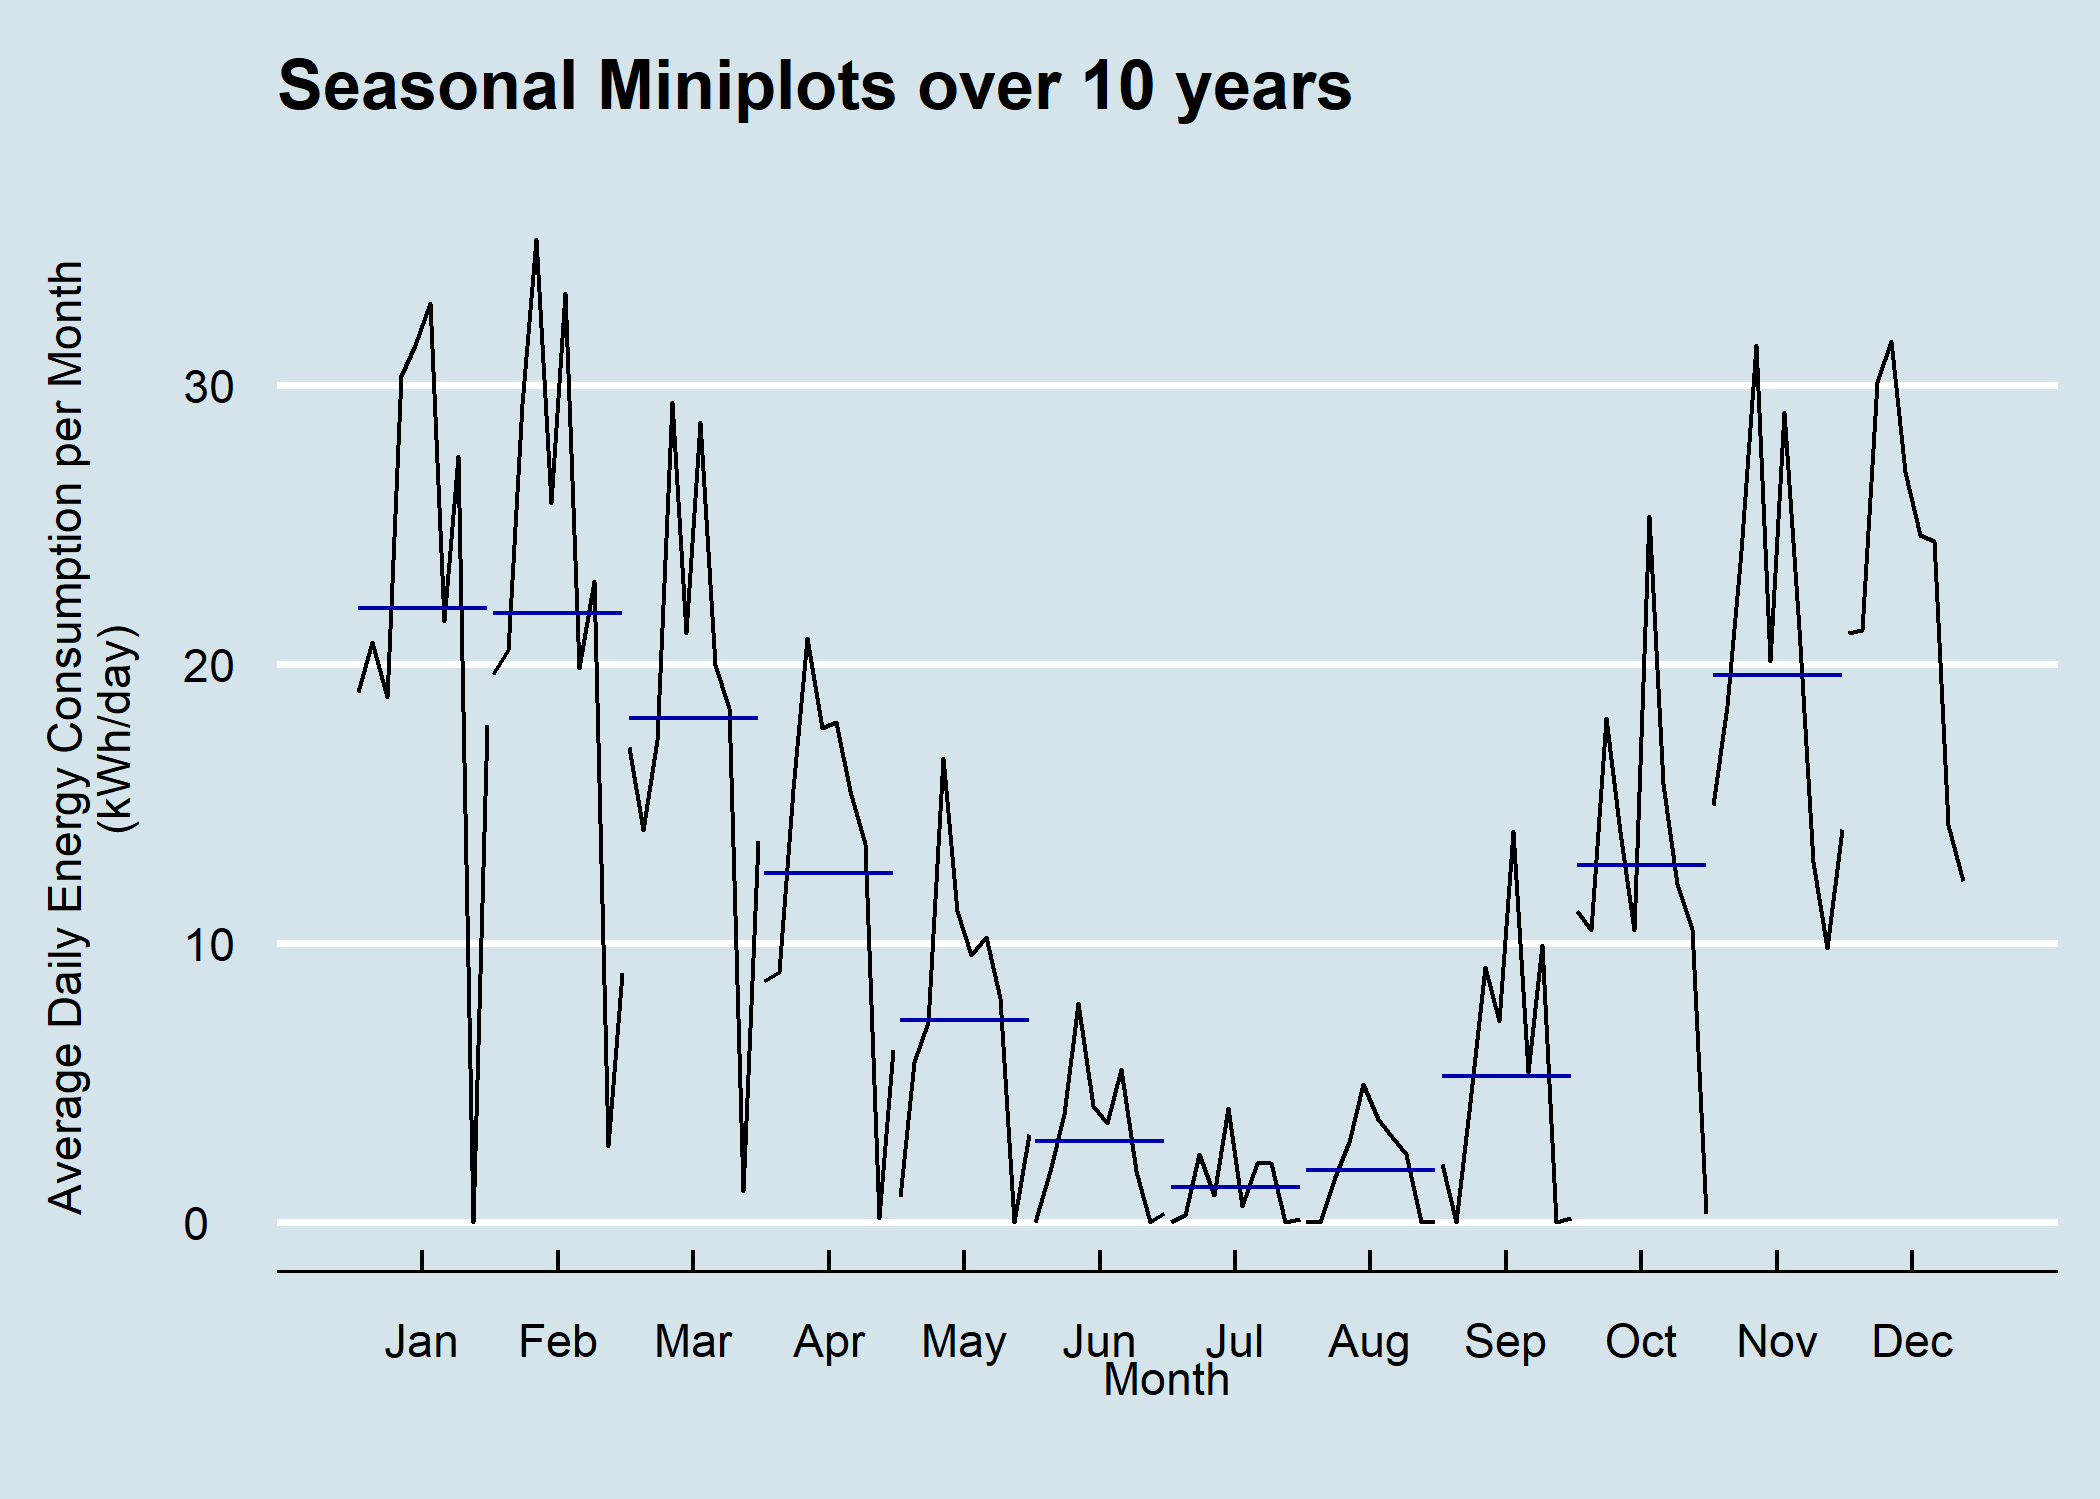
Figure 11.4: Seasonal Plot with mini Time Plots over 10 Years
Here the seasonal patterns for each season are collected together in seprate mini time plots.
11.2.2 Data Basis
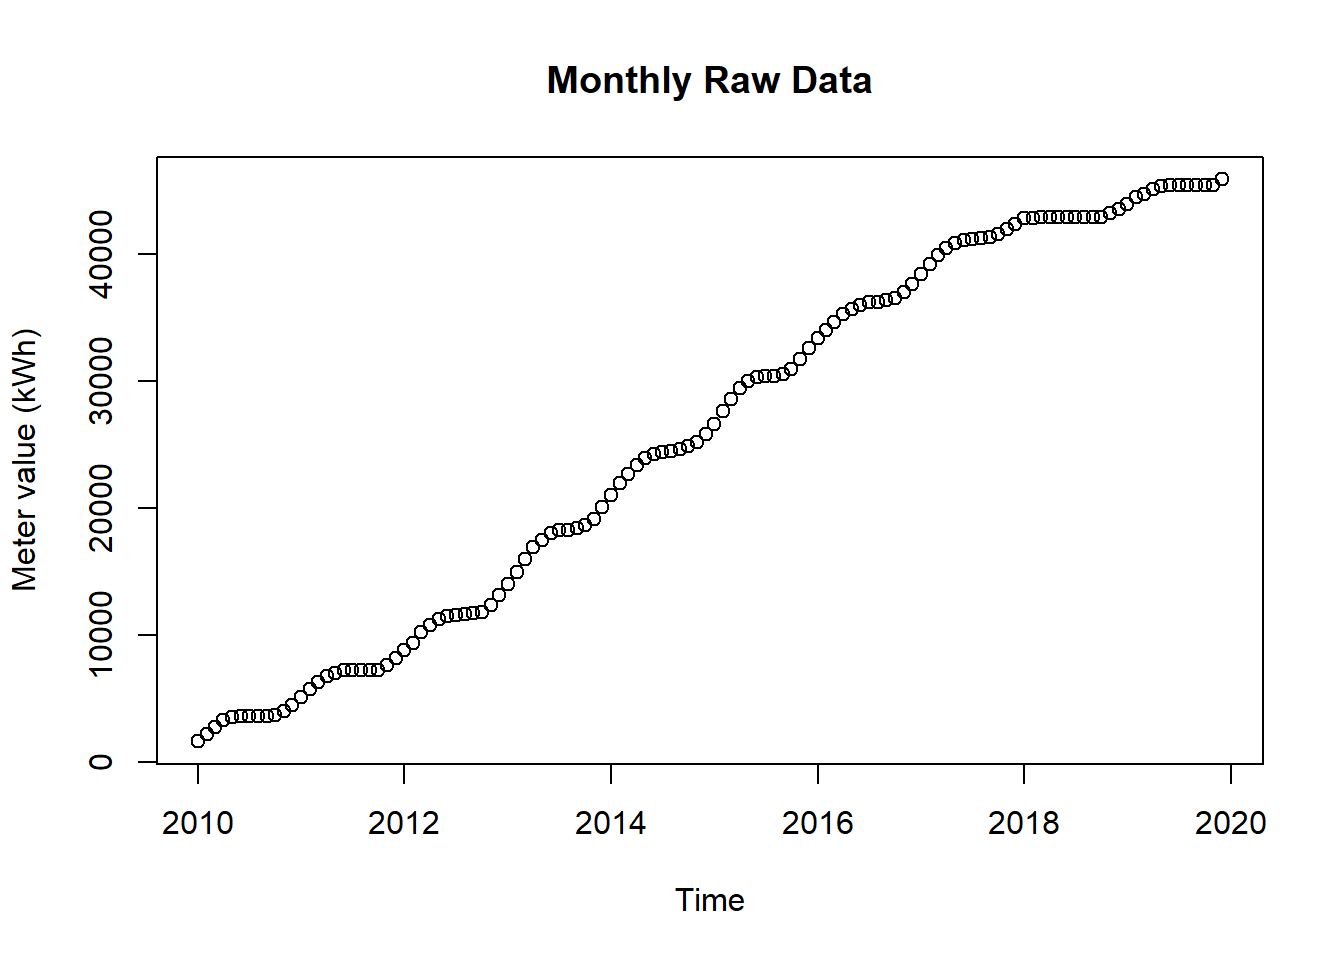
Figure 11.5: Raw Data for Seasonal Miniplots
11.2.3 Solution
Create a new script, copy/paste the following code and run it:
library(forecast)
library(dplyr)
library(plotly)
library(htmlwidgets)
library(ggthemes)
library(viridis)
library(lubridate)

# load csv file
df <- read.csv2("https://github.com/hslu-ige-laes/edar/raw/master/sampleData/flatHeatAndHotWater.csv",
                stringsAsFactors=FALSE)

# filter flat
df <- df %>% select(timestamp, Adr02_energyHeat)

colnames(df) <- c("timestamp", "meterValue")

# calculate consumption value per month
# pay attention, the value of 2010-02-01 00:00:00 represents the meter reading on february first,
# so the consumption for february first is value(march) - value(february)!
df <- df %>% dplyr::mutate(value = lead(meterValue) - meterValue)

# remove counter value column and calculate consumption per day instead of month
df <- df %>%
  select(-meterValue) %>%
  mutate(value = value /lubridate::days_in_month(timestamp))

# value correction (outlier because of commissioning)
df[1,2] <- 19

# create time series object for ggmonthplot function
df.ts <- ts(df[-1], frequency = 12, start = min(year(df$timestamp)))

# create x/y plot

numYears = length(unique(year(df$timestamp)))

plot <- ggmonthplot(df.ts,
                    col = viridis(numYears),
                    main = "Seasonal Miniplots over 10 years\n",
                    ylab = "Average Daily Energy Consumption per Month \n(kWh/day)\n",
                    xlab = "Month\n "
                    )

# change theme (optional)
plot <- plot + ggthemes::theme_economist()

# make plot interactive (optional)
plotly <- plotly::ggplotly(plot)

# show plot
plotly11.2.4 Discussion
This type of seasonal plot shows the mean value of each month and therefore emphasises on the monthly comparison
It revelas as well the mean seasonal pattern with the blue lines