2.3 Create your first R Script
Finally, you have installed “R” and “RStudio” with some packages on your computer. Good, hopefully everything worked fine up to now.
Let’s create the first script with a visualization:
Open “RStudio” just as you would any program, by clicking on its icon
Go to the menu on the top left and click to
File / New File / R ScriptCopy the following code and paste it into your script:
library(graphics)
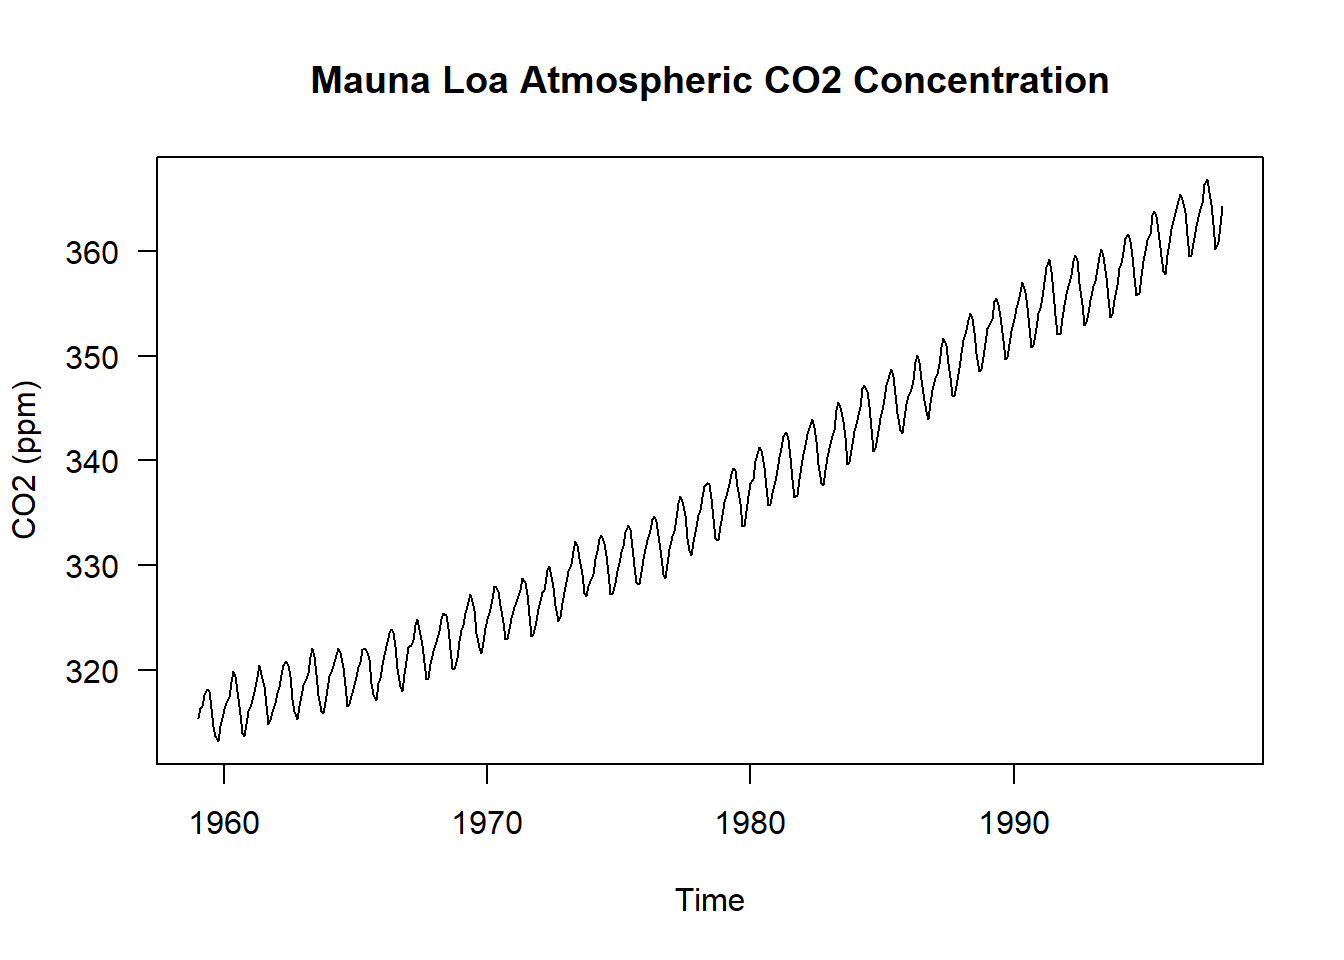
plot(co2, ylab = "CO2 (ppm)", las = 1)
title(main = "Mauna Loa Atmospheric CO2 Concentration")
select all by pressing
Ctrl + AThren run the code by pressing the
RunButton orCtrl + Enter
You should now get your first visualization:

As you probably noticed, we did not load any data. The basic installation of “R” and some packages come with test data. So that is an easy way to test something. The R Dataset Package provides some preinstalled datasets, including the used “Mauna Loa Atmospheric CO2 Concentration” dataset.