16.5 Plotly Multiple Y Axis
16.5.1 Goal
You want to create a plot with more than one y axis:
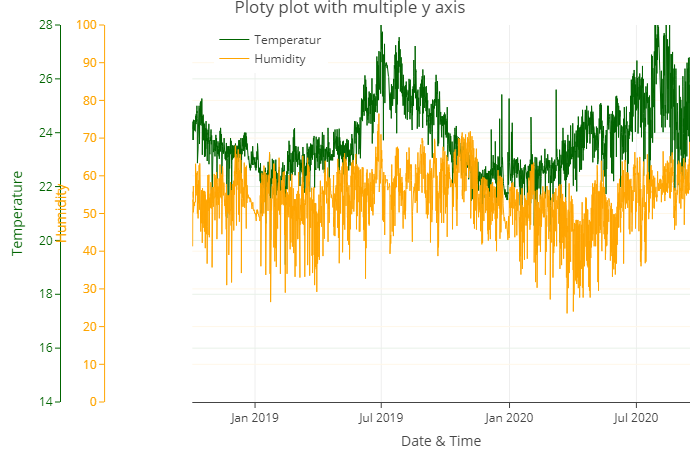
Figure 16.12: Plotly Polot with Multiple Y Axis
16.5.2 Solution
Create a new script, copy/paste the following code and run it:
library(redutils)
library(dplyr)
library(lubridate)
library(plyr)
library(plotly)

# read and print data
data <- read.csv("https://github.com/hslu-ige-laes/edar/raw/master/sampleData/flatTempHum.csv",
                 stringsAsFactors=FALSE,
                 sep =";")

# select temperature and humidity and remove empty cells
data <- data %>% select(time, FlatA_Temp, FlatA_Hum) %>% na.omit()
colnames(data) <- c("time", "tempRaw", "humidityRaw")

# create plot
# axis properties
minyaxis1 <- floor(min(14.0,min(data$temperature)))
maxyaxis1 <- ceiling(max(28.0,max(data$temperature)))
minyaxis2 <- 0.0
maxyaxis2 <- 100.0

dateRange <- c(min(data$time), max(data$time))
plotColors <- c("darkgreen", "orange")
pAxisSpacer <- 0.07

plot <- plot_ly(data, x = ~time) %>%
  add_lines(y = ~tempRaw,
            type="scatter",
            mode="lines",
            name='Temperatur',
            line = list(color = plotColors[1], width = 1)
            ) %>%
  add_lines(y = ~humidityRaw,
            type="scatter",
            mode="lines",
            name='Humidity',
            yaxis='y2',
            line = list(color = plotColors[2], width = 1)
            ) %>%
  layout(
    xaxis = list(title = "Date & Time",
                 domain = c(pAxisSpacer*3, 1),
                 type = "date",
                 range = dateRange,
                 ticks='outside',
                 zeroline=TRUE,
                 showline = T),
    yaxis = list(title = 'Temperature',
                 side = "left",
                 color = plotColors[1],
                 range = c(minyaxis1,maxyaxis1),
                 ticks='outside',
                 dtick = 2,
                 tick0 = minyaxis1,
                 tickmode = "linear",
                 position = 0,
                 anchor = 'free',
                 zeroline = F,
                 showline = T),
    yaxis2 = list(title = 'Humidity',
                  side = "left",
                  color = plotColors[2],
                  range = c(minyaxis2,maxyaxis2),
                  ticks='outside',
                  dtick = 10,
                  tick0 = minyaxis2,
                  tickmode = "linear",
                  position = pAxisSpacer,
                  overlaying = "y",
                  anchor = 'free',
                  zeroline=F,
                  showline = T),
    legend = list(x=pAxisSpacer*3.5, y= 1),
    showlegend = T,
    title = list(text = "Ploty plot with multiple y axis")
  )
plot