11.3 Polar
11.3.1 Goal
Plot a seasonal plot as described in Hyndman and Athanasopoulos (2014, chapter 2.4):
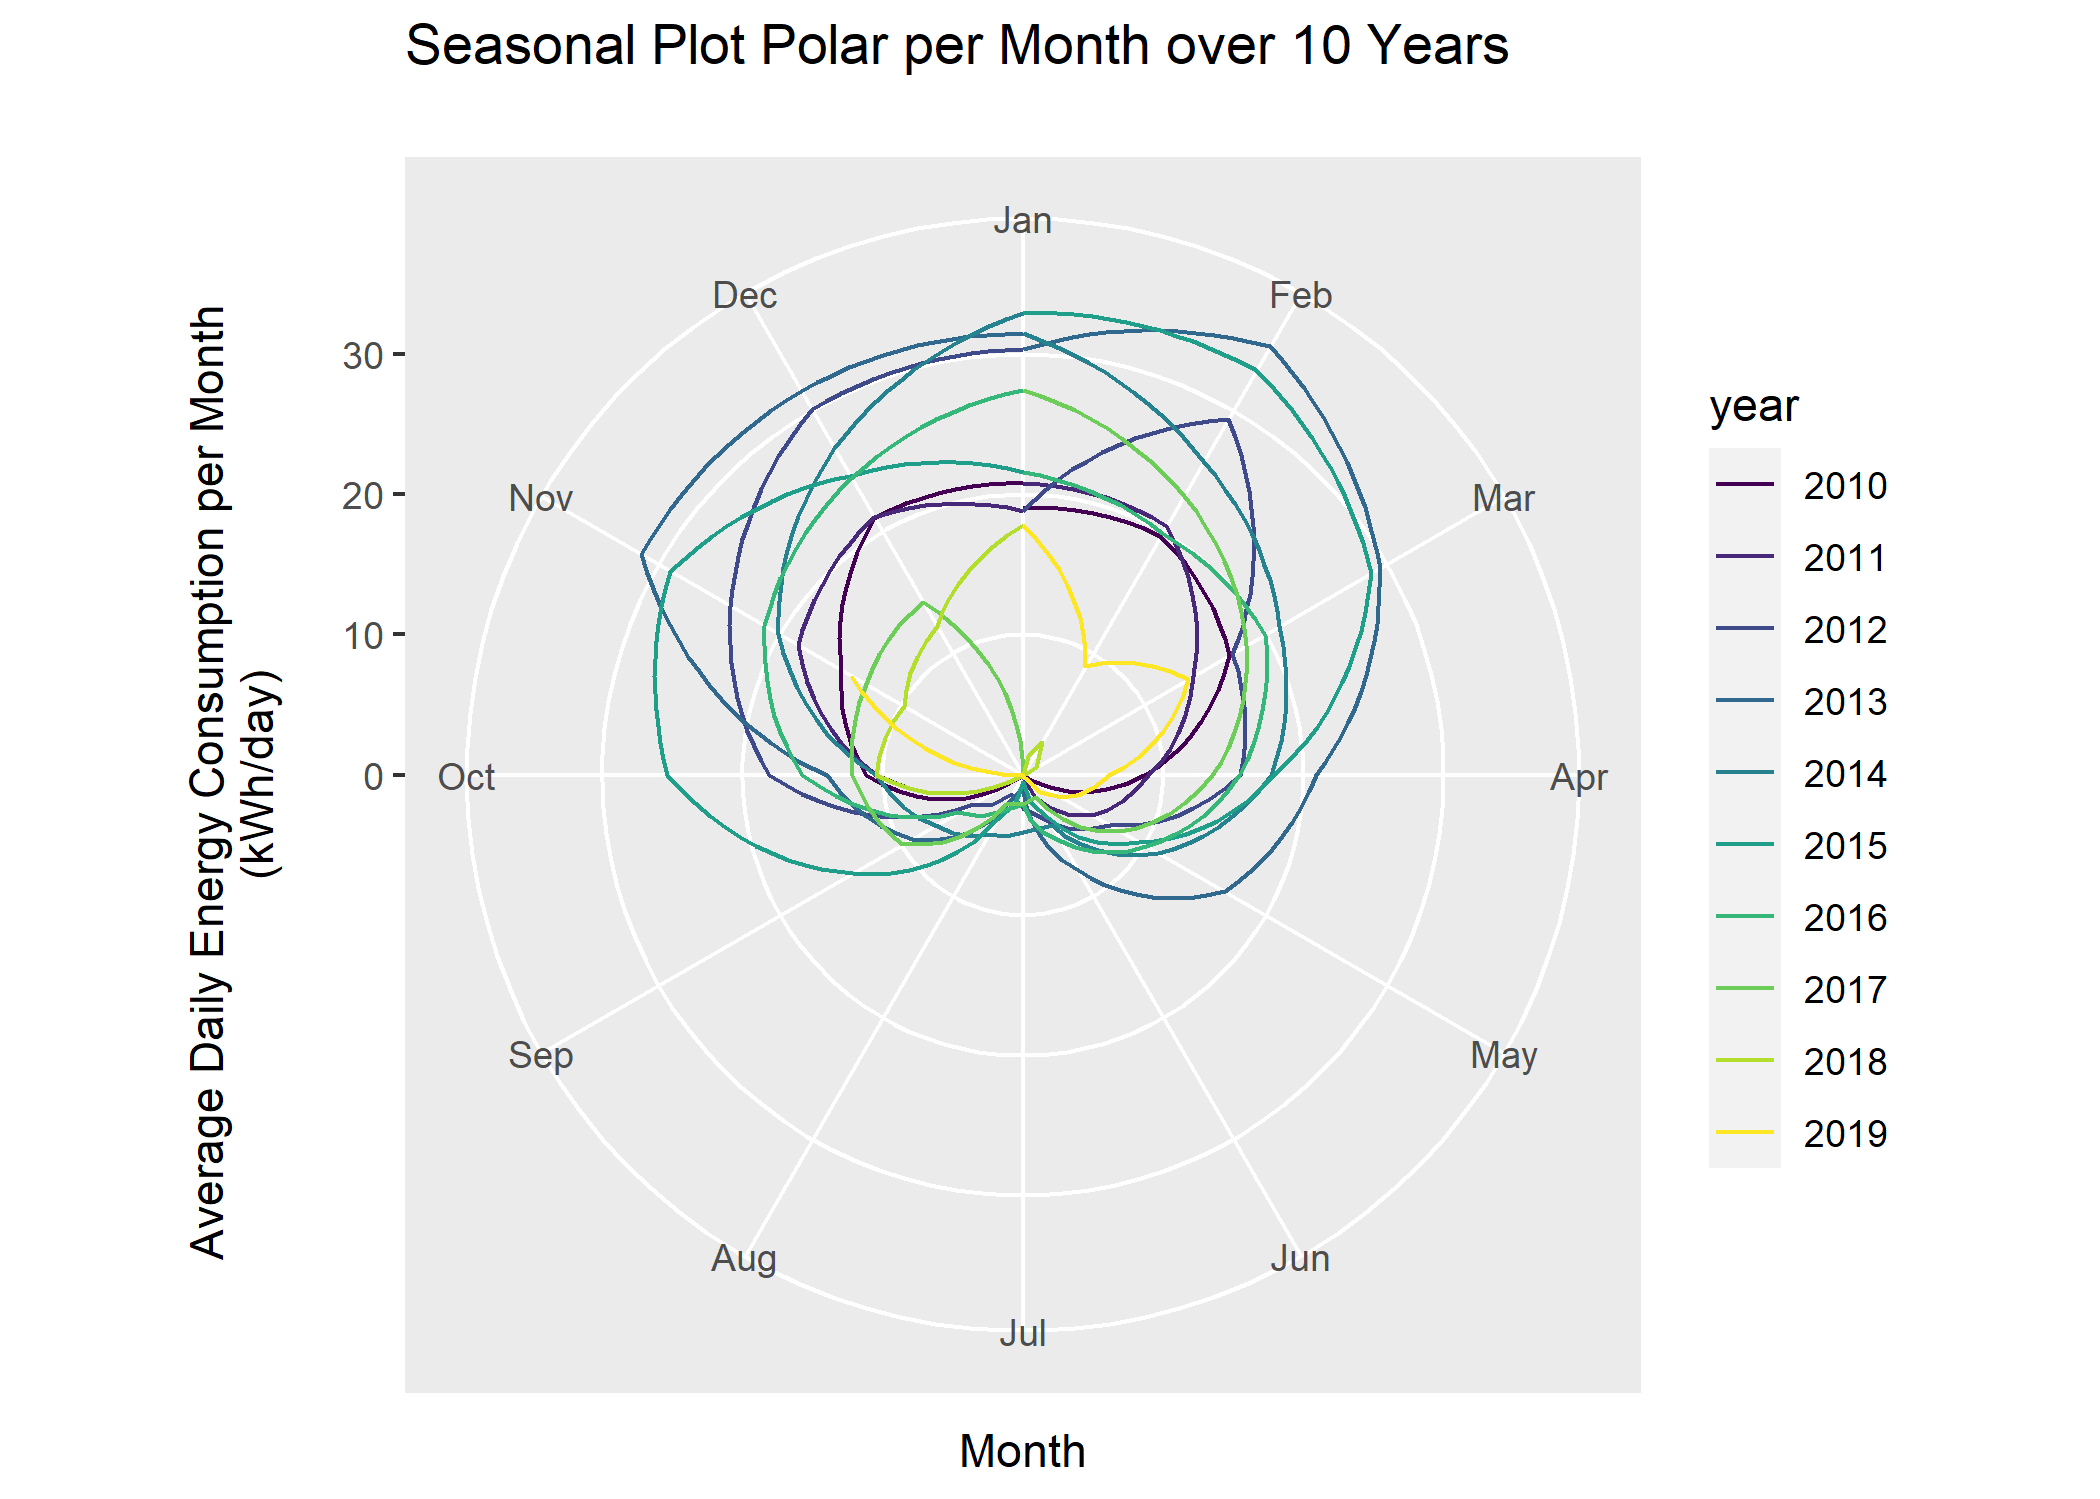
Figure 11.6: Seasonal Plot Polar per Month over 10 Years
This is like an overlapping time series plot which uses polar coordinates. Be aware that seasons in this context don’t correlate with the seasons of the year.
11.3.2 Data Basis
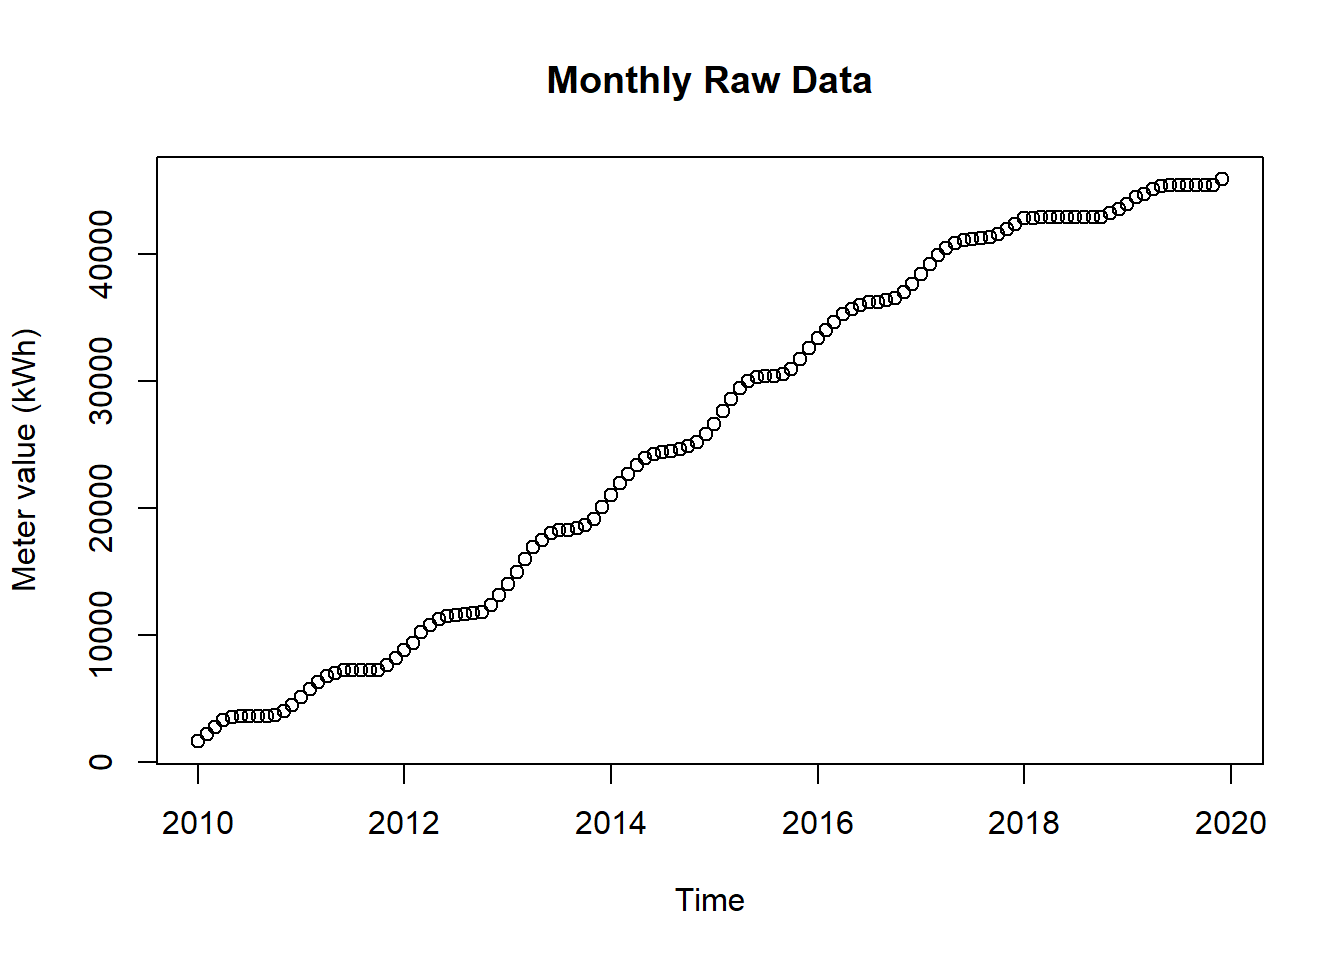
Figure 11.7: Raw Data for Seasonal Plot Polar
11.3.3 Solution
Create a new script, copy/paste the following code and run it:
library(forecast)
library(dplyr)
library(plotly)
library(htmlwidgets)
library(ggthemes)
library(viridis)
library(lubridate)

# load csv file
df <- read.csv2("https://github.com/hslu-ige-laes/edar/raw/master/sampleData/flatHeatAndHotWater.csv",
                stringsAsFactors=FALSE)

# filter flat
df <- df %>% select(timestamp, Adr02_energyHeat)

colnames(df) <- c("timestamp", "meterValue")

# calculate consumption value per month
# pay attention, the value of 2010-02-01 00:00:00 represents the meter reading on february first,
# so the consumption for february first is value(march) - value(february)!
df <- df %>% dplyr::mutate(value = lead(meterValue) - meterValue)

# remove counter value column and calculate consumption per day instead of month
df <- df %>%
  select(-meterValue) %>%
  mutate(value = value /lubridate::days_in_month(timestamp))

# value correction (outlier because of commissioning)
df[1,2] <- 19

df.ts <- ts(df %>% select(value) %>% na.omit(), frequency = 12, start = min(year(df$timestamp)))

# create polar plot

numYears = length(unique(year(df$timestamp)))

plot <- ggseasonplot(df.ts,
                     col = viridis(numYears),
                     main = "Seasonal Plot Polar per Month over 10 Years\n",
                     ylab = "Average Daily Energy Consumption per Month \n(kWh/day)\n",
                     polar = TRUE
                     )

# show plot (interactive version with plotly unfortunately not possible)
plot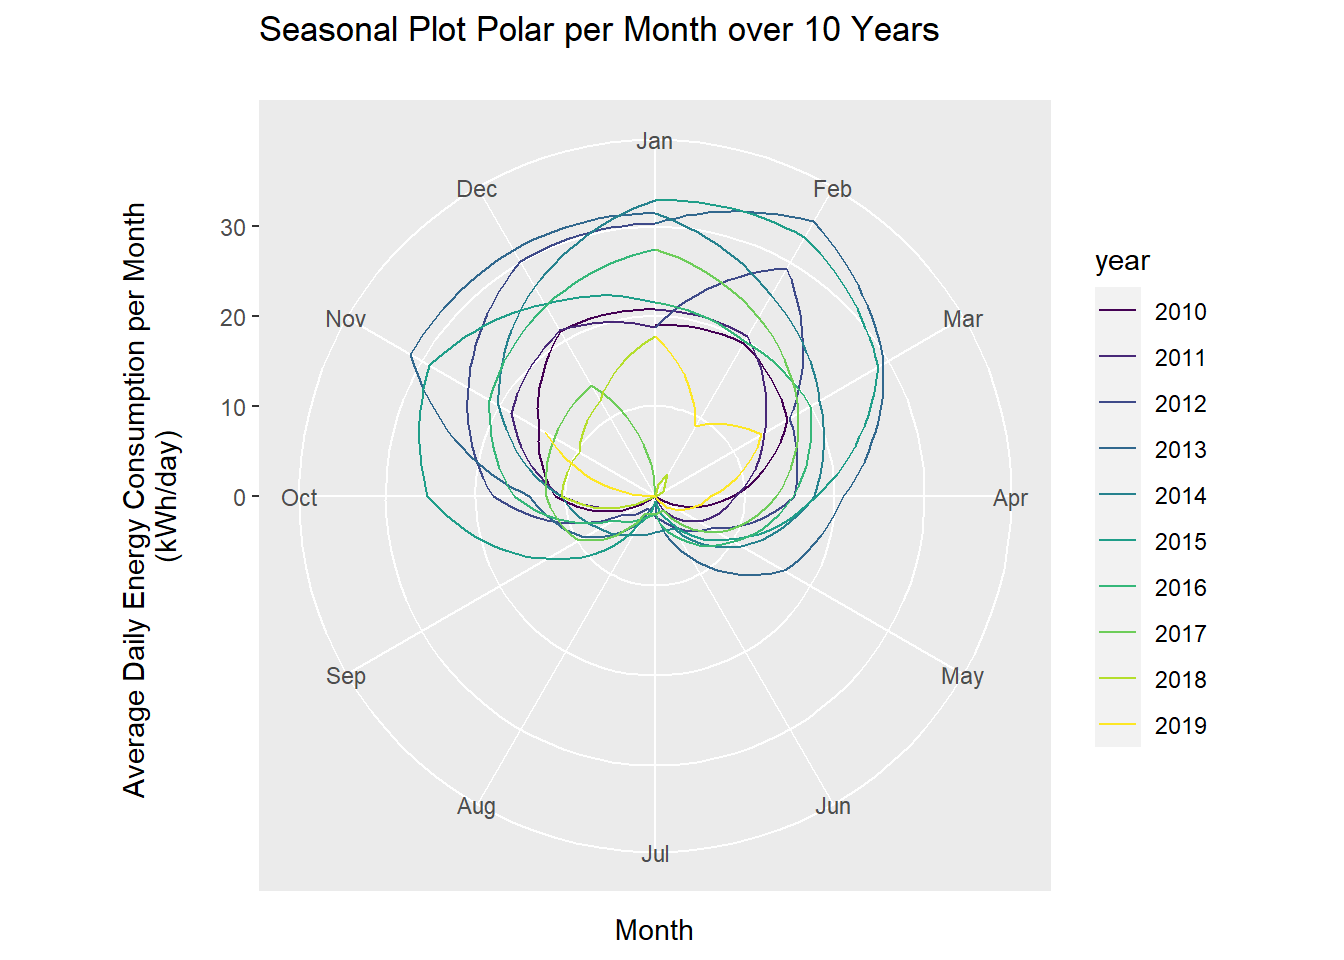
11.3.4 Discussion
This representation emphasizes the high consumption in summer very well, which could undoubtedly be reduced in a residential building. The Years 2018 and 2019 show, that this optimization was done.
To emphasize this optimization please refer to chapter 11.4.