7.2 Quick Data Visualizations
Please refer to the R Graphics Cookbook from Winston Chang - Chapter 2 “Quickly Exploring Data”.
This is a great resource where you can find everything you need to know about creating basic plots. Some plots of the part “Data Visualizations” are as well easy to create and can get used in the context of EDA.
library(dplyr)
library(lubridate)
# load csv file
df <- read.csv2("https://github.com/hslu-ige-laes/edar/raw/master/sampleData/flatHeatAndHotWater.csv",
                stringsAsFactors=FALSE)
# filter flat
df <- df %>% select(timestamp, Adr01_energyHeat, Adr02_energyHeat, Adr03_energyHeat)
#df <- df %>% filter(timestamp > "2014-12-01")

df <- df %>% dplyr::mutate(FlatA = lead(Adr01_energyHeat) - Adr01_energyHeat)
df <- df %>% dplyr::mutate(FlatB = lead(Adr02_energyHeat) - Adr02_energyHeat)
df <- df %>% dplyr::mutate(FlatC = lead(Adr03_energyHeat) - Adr03_energyHeat)

# remove counter value column
df <- df %>% select(-Adr01_energyHeat, -Adr02_energyHeat, -Adr03_energyHeat) %>% na.omit()
df$timestamp <- parse_date_time(df$timestamp,
                                orders = "YmdHMS",
                                tz = "Europe/Zurich")

tsd <- ts(df %>% select(-timestamp), frequency = 12, start = min(year(df$timestamp)))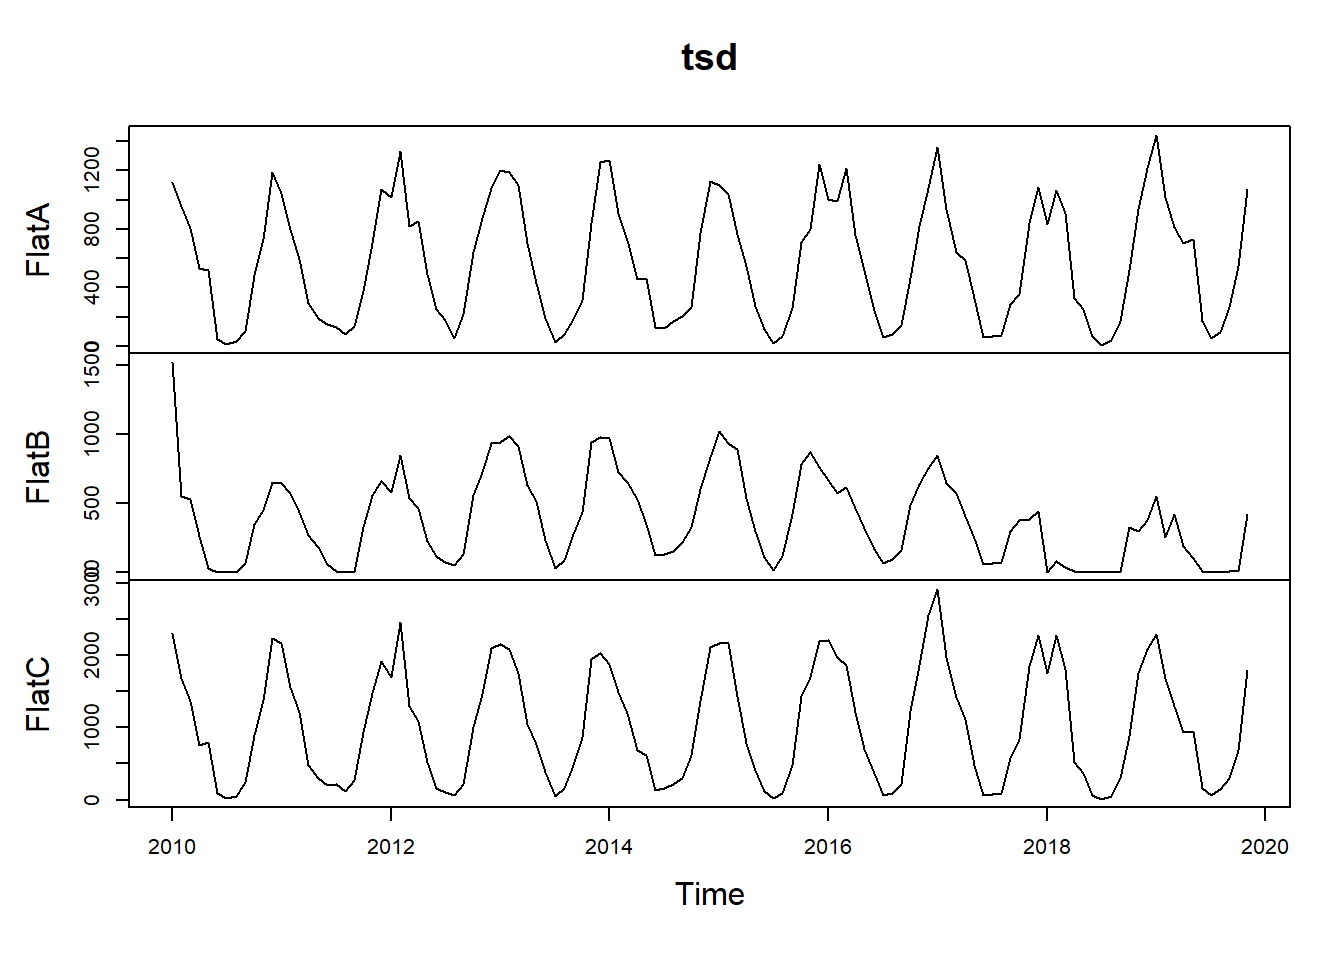
7.2.2 Multiple time series plot in one plot
# Plotting all in one frame
colours<-c("green3","red3","blue3")

plot(tsd,plot.type="single",ylab="(kWh)",col=colours)

# Legend
ltxt<-c("Flat A", "Flat B", "Flat C")
legend("topleft",lty=1,col=colours, legend=ltxt)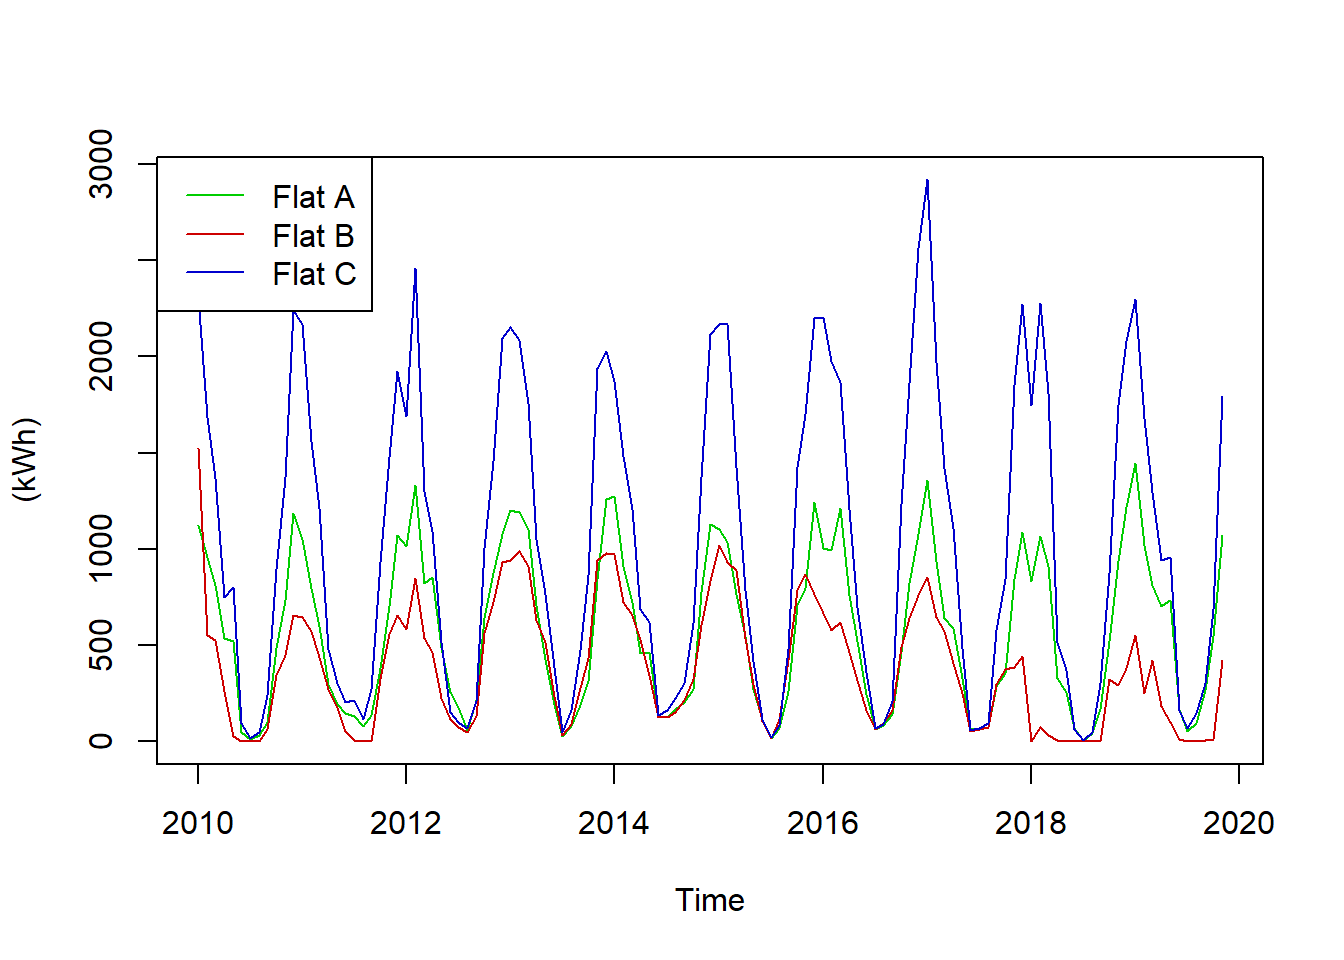
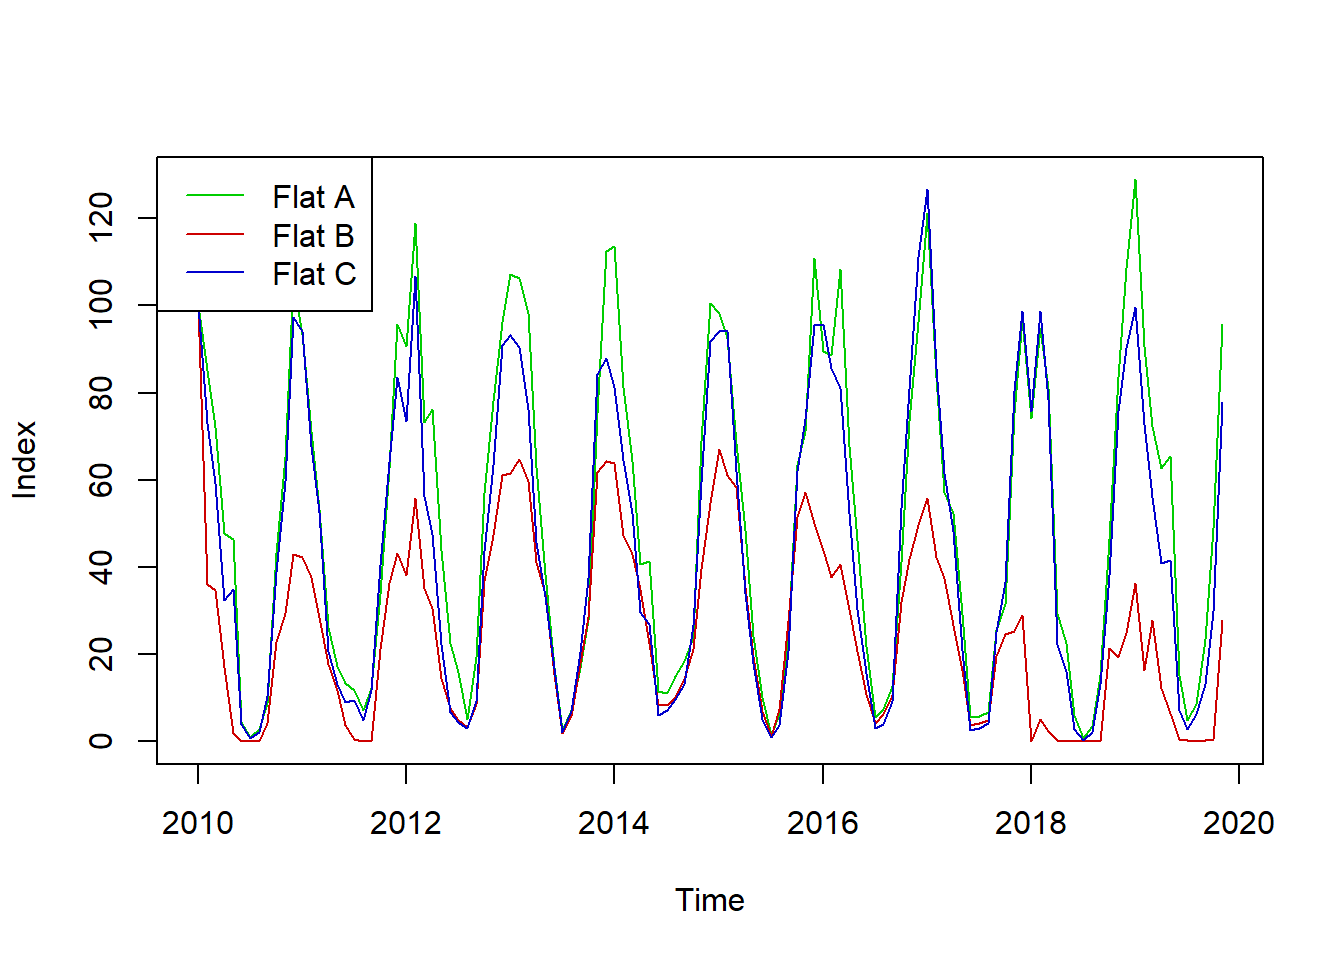
7.2.3 Indexed time series plot
tsdPlot <- tsd

# Index timeseries
tsdPlot[,1]<-tsdPlot[,1]/tsdPlot[1,1]*100
tsdPlot[,2]<-tsdPlot[,2]/tsdPlot[1,2]*100
tsdPlot[,3]<-tsdPlot[,3]/tsdPlot[1,3]*100

# Plotting all in one frame
colours<-c("green3","red3","blue3")

plot(tsdPlot,plot.type="single",ylab="Index",col=colours)

# Legend
ltxt<-c("Flat A", "Flat B", "Flat C")
legend("topleft",lty=1,col=colours, legend=ltxt)