Visualization(s)
Room versus Outside Temperature
This Diagram comes from the standard SIA 180:2014 [1, p. 24-25]. It is mentioned in the planning context as part of the proof of summer room temperatures.
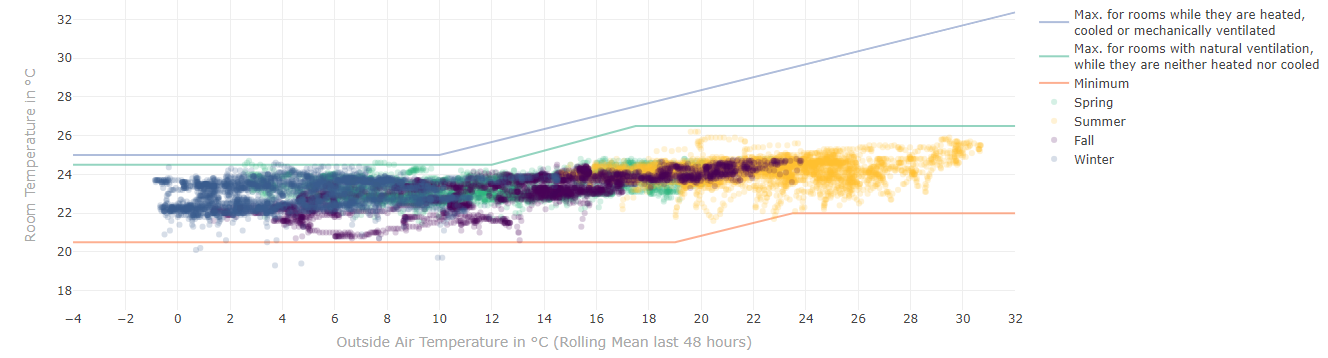
- The indoor temperature, which is perceived as comfortable, tends to be higher, even if the outdoor temperature is higher. This shift saves a lot of energy.
- The x-axis shows the moving average value of the outside air temperature over the last 48 hours. The y-axis the “perceived” room temperature.
- There are three limits
- Top line: Maximum limit for rooms with natural ventilation, while they are neither heated nor cooled
- Center line: Maximum limit rooms while they are heated, cooled or mechanically ventilated
- Bottom line: Minimal allowed temperature (same line for both maximum lines)
- Tooltip: Place the mouse pointer over a datapoint to get more information of a specific measurement.
Settings
Basic
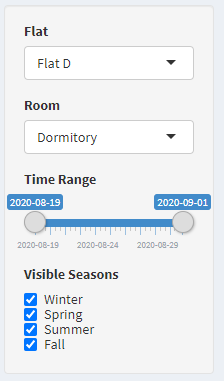
Flat and Room
- Selection of flat resp. room which should get analyzed.
- According to the building hierarchy all flats and rooms get listet which have a datapoint of type “tempRoom” or “humRoom”.
Time Range
- The date left is automatically the oldest timestamp and on the right side the newest.
- Narrow the time range to make comparisons.
Visible Seasons
- The points are colored according to the season.
- With the checkboxes the measurements of a season can be shown and hidden individually.
Extended
- To access the extended settings, the plus symbol in the upper right corner of the title bar must be pressed.
- Per default the extended settings tab is collapsed.
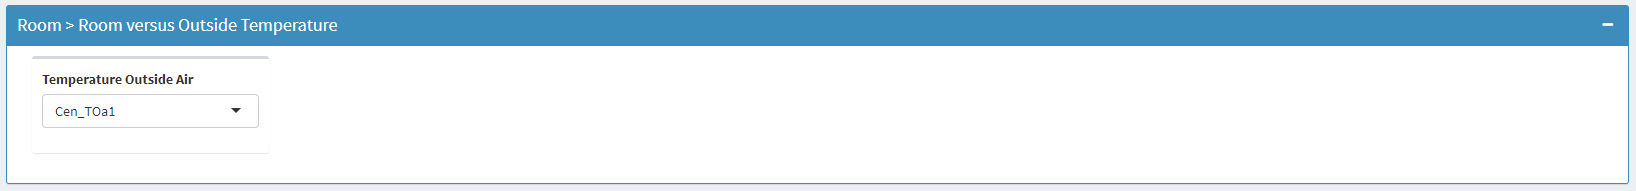
Temperature Outside Air
- Selection of the outdoor temperature sensor if more than one is configured under
Settings -> Data Points.
References
[1] SIA Schweizerischer Ingenieur- und Architektenverein (2014). Wärmeschutz, Feuchteschutz und Raumklima in Gebäuden. (SN/EN, SIA 180).