Visualization(s)
Relative Heating Energy Building per Year
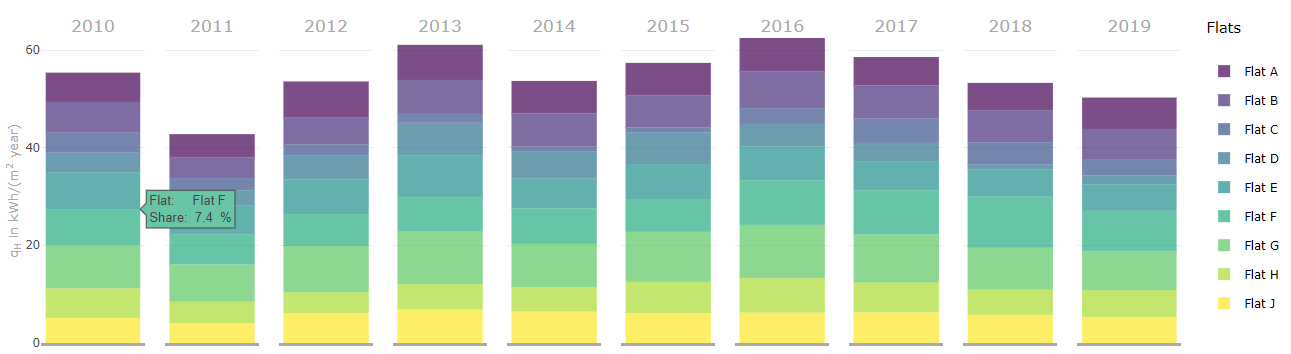
- The stacked bar plot shows the relative heating energy of all configured flats in kWh/(m2 year)
- This visualization allows a yearly comparison of the total and changes of energy consumption shares
- Tooltip: Place the mouse pointer over a section to get more information
Relative Heating Energy Flats per Year
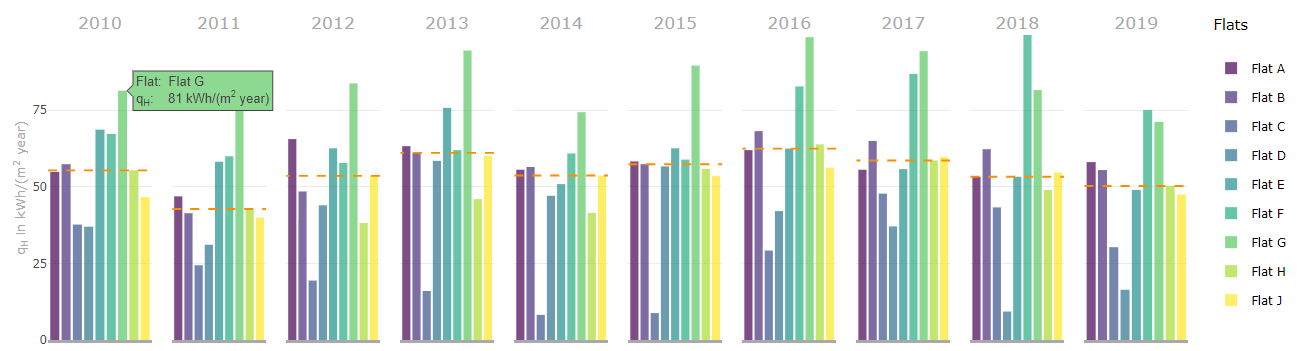
- The side by side bar plot shows the relative heating energy of all configured flats in kWh/(m2 year)
- This visualization allows a yearly comparison between flats
- Tooltip: Place the mouse pointer over a section to get more information
Relative Heating Energy Building per Month
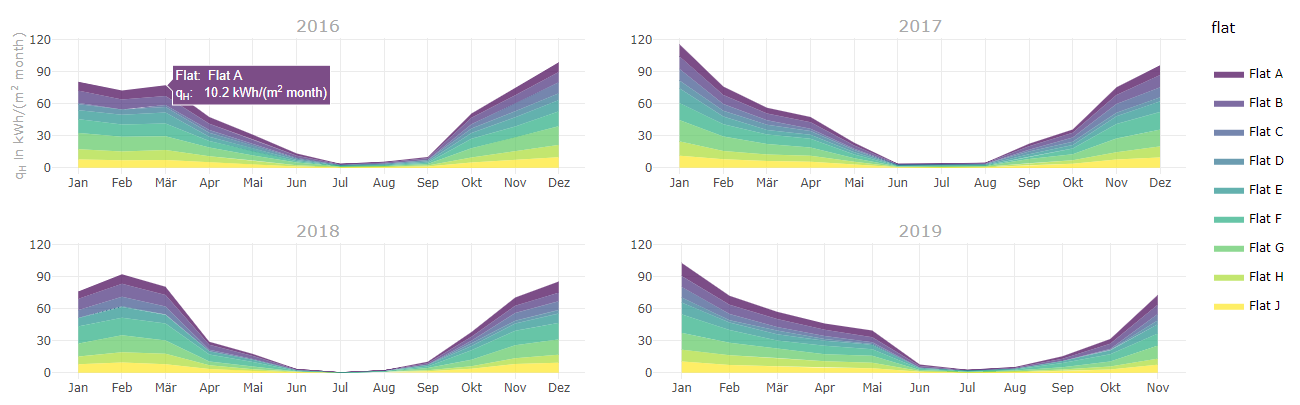
- The stacked area plot shows the relative heating energy of all configured flats in kWh/(m2 month)
- This visualization allows a yearly comparison and allows easy determination of min- and max consumptions per year
- Tooltip: Place the mouse pointer over a section to get more information
Relative Heating Energy Flats per Month
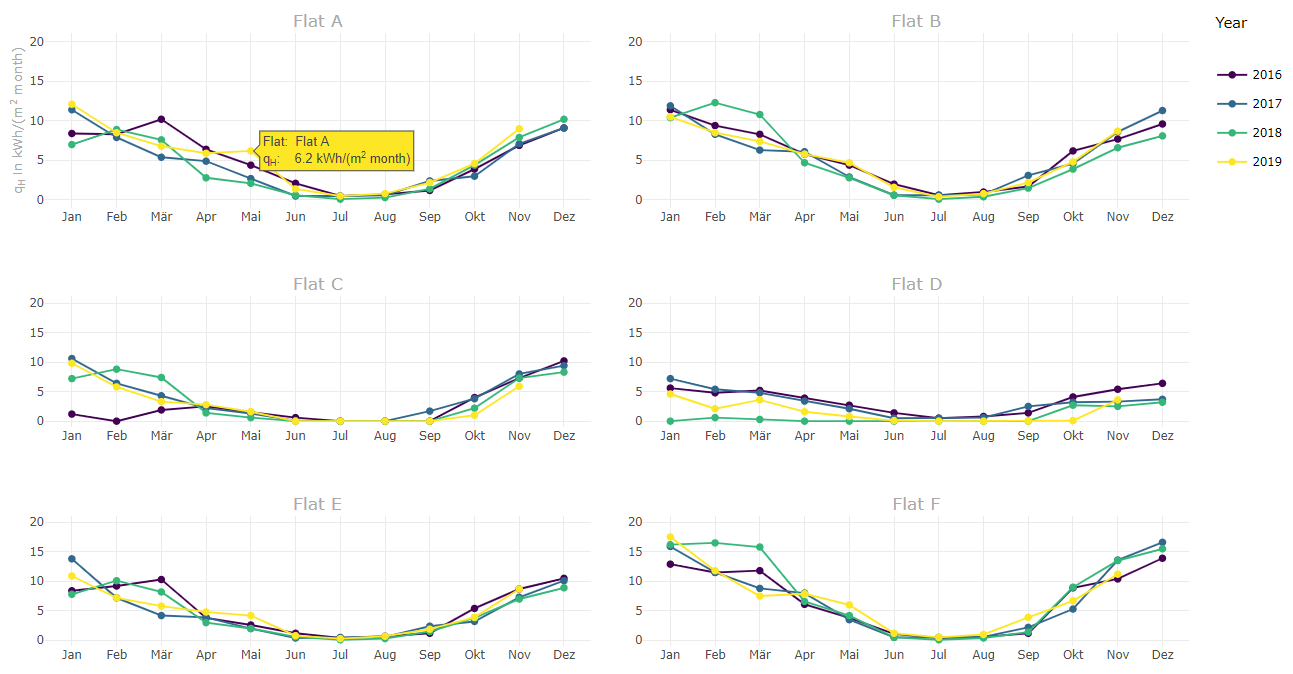
- The line plot shows the relative heating energy of all configured flats in kWh/(m2 month)
- This visualization allows comparisons beteween years of one flat and between flats in one view
- Tooltip: Place the mouse pointer over a section to get more information
Settings
Basic
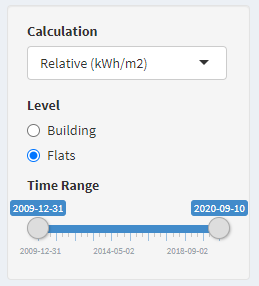
Calculation
- Selection of unit, either kWh or kWh/m2
- the size of a flat comes from
Settings > Building Hierarchy
Level
- Changes the type of plot. “Building” stackes the values to point out the total, “Flats” shows individual values for comparison.
Time Range
- The date left is automatically the oldest timestamp and on the right side the newest.
- Narrow the time range to make comparisons.
Extended
no extended settings