Visualization(s)
Heating Signature
This visualization allows a quick detection of malfunctions and provides valuable information on the energy efficiency of the building.
- A constant indoor temperature is assumed.
- It is also assumed that the outside temperature is the parameter with the greatest influence on heating energy consumption.
- This method is suitable for buildings with stable internal heat loads and relatively low passive solar heat loads.
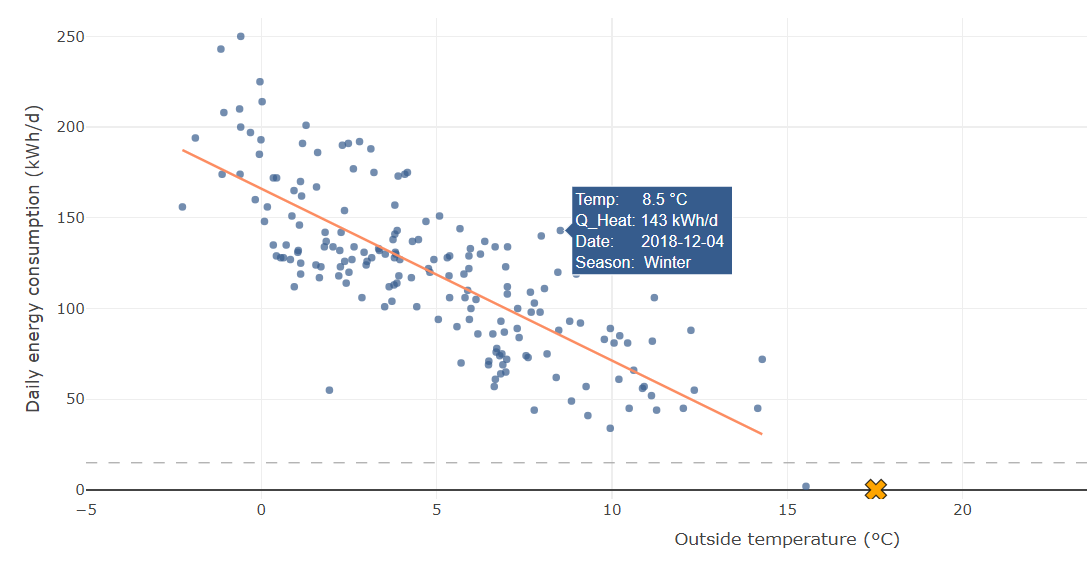
- The x-axis represents the average outdoor temperature.
- The y-axis the daily energy consumption.
- Tooltip: Place the mouse pointer over a datapoint to get more information of a specific measurement.
Settings
Basic
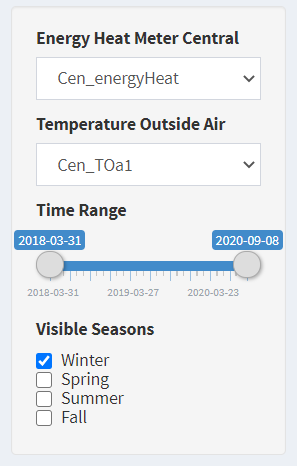
Energy Heat Meter Central
- Selection of the heat meter.
Temperature Outside Air
- Selection of the outside air temperature sensor.
Time Range
- The date left is automatically the oldest timestamp and on the right side the newest.
- Narrow the time range to make comparisons.
Visible Seasons
- The points are colored according to the season.
- With the checkboxes the measurements of a season can be shown and hidden individually.
Extended
- To access the extended settings, the plus symbol in the upper right corner of the title bar must be pressed.
- Per default the extended settings tab is collapsed.
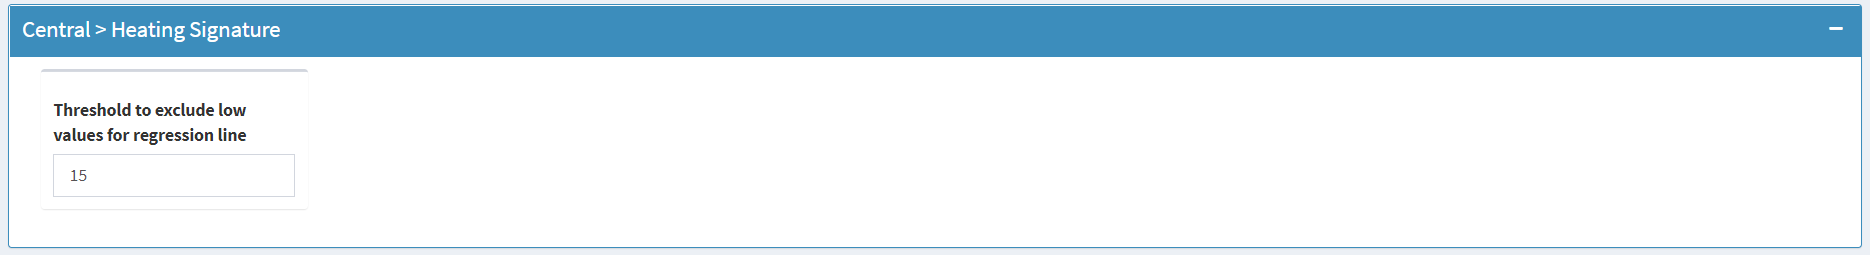
Threshold to exclude low values for regression line
- Used for the regression line for outlier removal.