Visualization(s)
Heating Curve
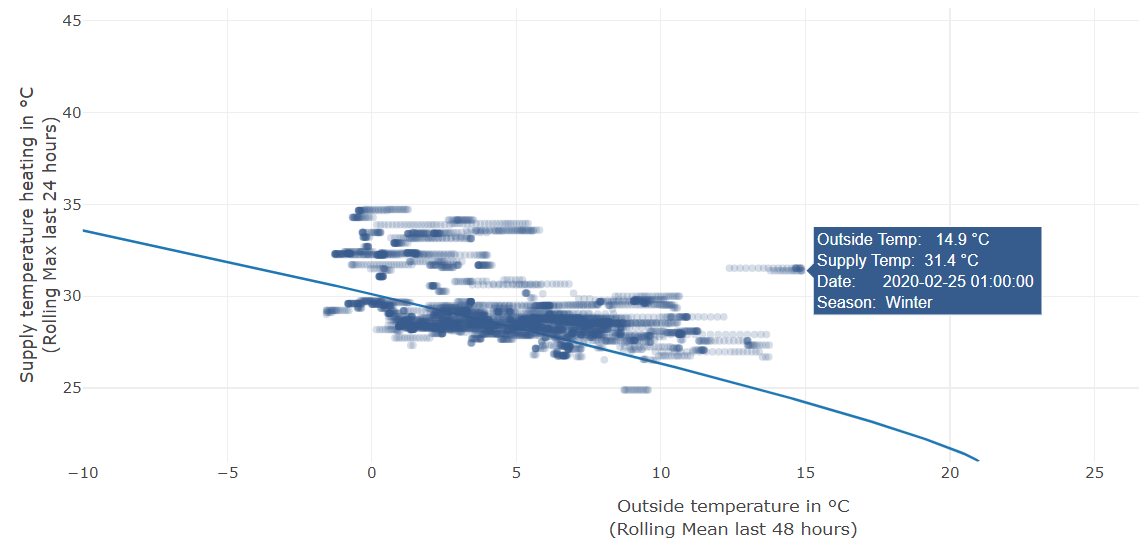
- The x-axis represents the average outdoor temperature.
- The y-axis the supply heat temperature.
- the line represents the heating curve which can get adapted in the extended settings.
- Tooltip: Place the mouse pointer over a datapoint to get more information of a specific measurement.
Settings
Basic
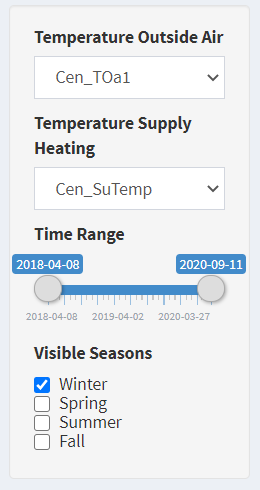
Temperature Outside Air
- Selection of the outside air temperature sensor.
Temperature Supply Heating
- Selection of the supply heat temperature sensor.
Time Range
- The date left is automatically the oldest timestamp and on the right side the newest.
- Narrow the time range to make comparisons.
Visible Seasons
- The points are colored according to the season.
- With the checkboxes the measurements of a season can be shown and hidden individually.
Extended
- To access the extended settings, the plus symbol in the upper right corner of the title bar must be pressed.
- Per default the extended settings tab is collapsed.
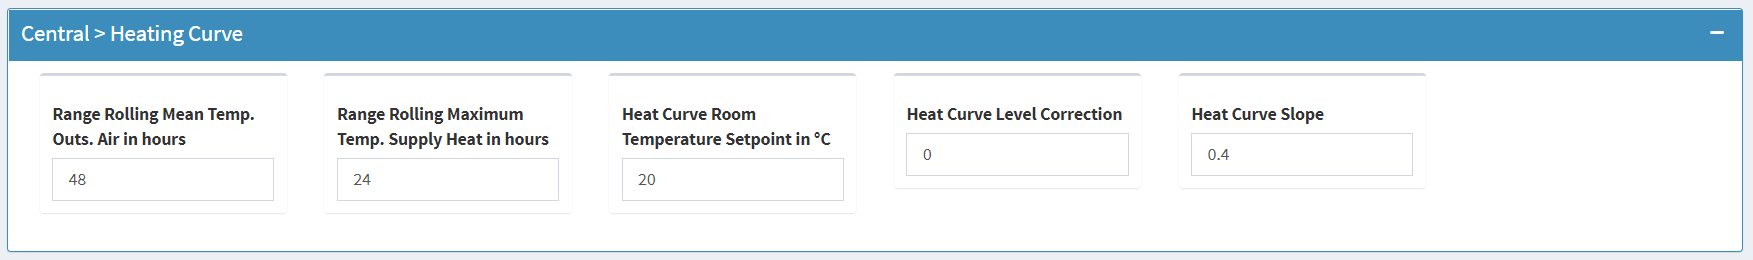
Range Rolling Mean Temp. Outs. Air in hours
- In order to take into account the inertia of the building and to compensate for daytime fluctuations, the heating controller often works with a moving average over a certain number of hours.
- If known, enter the real value here.
Range Rolling Maximum Temp. Supply Heat in hours
- The flow temperature fluctuates quite strongly, depending on whether the heating group is switched on or off.
- In addition, the temperature rarely reaches a steady state.
- Therefore a sliding maximum value is used to try to determine useful values with simple analytical means.
Heat Curve Room Temperature Setpoint in °C
- Heating Curve Setpoint of the romm temperature
Heat Curve Level Correction
- Paralell correction of the heating curve, positive values shift the curve up and negative values down
Heat Curve Slope
- Slope of the heating curve