LoRaWAN Field Testing Guideline
This guide helps you test LoRaWAN coverage and decide when to install a gateway
Table of contents
- What You Need
- Typical Range of Transmission
- Key Parameters
- How to Test Coverage
- How to Interpret the Results in Detail
- Tips
- Further Resources
What You Need
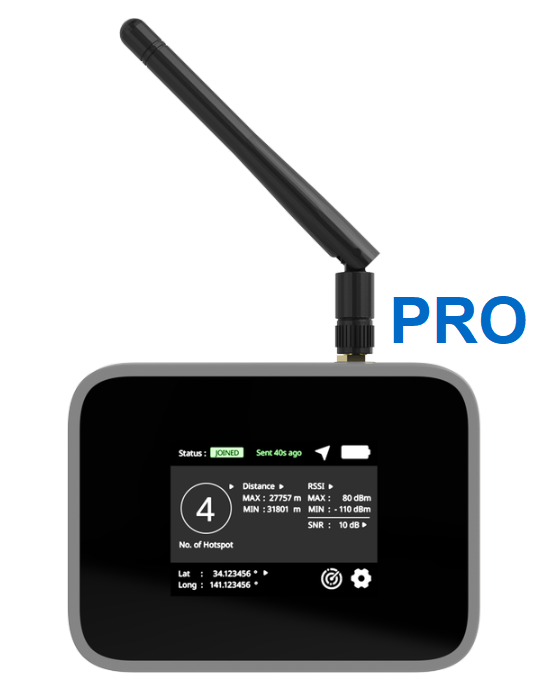
- A LoRaWAN connection tester (e.g., RAK10701-P)
- LoRaWAN gateway(s) - public TTN gateways, or your own LTE gateways
- Notebook with Excel for recording results or oldstyle printed table:
Typical Range of Transmission
The typical range for LoRaWAN devices is a few hundred meters to a few kilometers in urban areas and several kilometers in rural or open environments. In some cases it is possible to place devices in buildings and have the next gateway somewhere outside. But that depends on multiple factors:
- Distance to the Gateway
The farther the sensor device is from the gateway, the weaker the signal, impacting communication reliability. - Gateway placement The higher and more central a gateway is, the better. But unfortunately signals often have more difficulties to traverse floors than walls. Do not place a gateway close to other machinery and electrical lines.
- Obstacles and Environment
Physical obstacles like buildings, walls, windows and trees can weaken or block the signal, affecting signal strength and range. - Gateway Density
More gateways -> better coverage, less packet loss, and improved battery life - Transmit Power of the Sensor Device
Higher transmit power allows for longer range but consumes more energy - so less battery life… - Environmental Factors
Weather, humidity, and atmospheric conditions can influence signal strength. Indoors open and closed doors can affect as well the signal. - Interference
Electronic noise or interference from other devices can impact reception and as well battery life. - Antenna Quality
The quality of antennas on both the sensor device and gateway affects range and reception quality. - Sensor Device Orientation
Each antenna has a designed orientation. Refer to the sensor device datasheets to see how you orient best the devices.
Key Parameters
Understanding RSSI (Received Signal Strength Indicator) and SNR (Signal-to-Noise Ratio) is crucial for evaluating LoRaWAN radio links. Use the tables below to quickly assess the signal quality at your test points.
RSSI
RSSI measures the strength of the received signal in decibels relative to 1 milliwatt (dBm). The values for RSSI in the LoRaWAN can typically range from around -120 dBm to -40 dBm. A value of -120 dBm indicates a very weak signal that is close to the reception limit, while a value of -40 dBm indicates a very strong signal.
| RSSI (dBm) | Label | Meaning |
|---|---|---|
| > -90 | Excellent | Very strong signal |
| -90 to -100 | Good | Strong signal |
| -100 to -115 | Fair | Usable, maybe unreliable |
| -115 to -125 | Bad | Weak, only works at high SF, add additional gateway |
| < -125 | Limit | Unusable; add additional gateway |
SNR Thresholds
SNR is a measure of how much stronger the signal is than the background noise. It is measured in decibels (dB). The SNR values in the LoRaWAN can range from around -20 dB to +14 dB.
- A negative SNR means that the noise is stronger than the signal, which typically occurs at very long distances or in poor environmental conditions.
- A positive SNR indicates that the signal is stronger than the noise, which is necessary for effective communication.
| SNR (dB) | Label | Meaning |
|---|---|---|
| > 5 | Excellent | Very clean signal |
| 0 to 5 | Good | Clean signal |
| -7 to 0 | Fair | Acceptable, may have issues at lowest SF |
| -15* to -7 | Bad | Very noisy, close to LoRa decoding limit |
| < -15* | Limit | Below decoding limit; add gateway/move device |
- Limit depends on DR/SF: -7.5dB (SF7) to -20dB (SF12)
How to use:
- Compare your measured RSSI and SNR values to the tables above.
- Both parameters should be at least in the Fair range for reliable operation; Good or Excellent is ideal.
- If you see Bad or Limit readings, adjust device placement, increase SF, or consider more gateways.
Data Rate, Spreading Factor & Battery Life
LoRaWAN transmission parameters affect both coverage and battery life. The three most important factors to understand are:
- Spreading Factor (SF): A higher SF increases range and signal robustness, but also greatly increases airtime (slows transmission) and drains battery faster. Lower SF means shorter range but much faster and more efficient messages.
- Data Rate (DR): This is directly linked to SF. Higher DR (lower SF) gives faster data transmission and saves battery, but is usable only with strong signal quality.
- Airtime & Minimum Sampling Rate: Each message takes a certain time “on air” (airtime). Duty cycle laws (e.g., 1% for EU868) set a strict minimum time between messages to avoid network congestion. The slower the data rate (higher SF), the longer you must wait before sending the next message.
TTN (The Things Network) Fair Use Policy and Restrictions:
When using public TTN infrastructure, further restrictions apply:
- Daily Uplink Limit: Max 30 seconds airtime per device per day (about 20-30 messages/day at SF12, up to 500/day at SF7 with short payloads).
- Max Payload: 51 bytes at SF12, up to 222 bytes at SF7. Always use the smallest payload possible.
- Downlinks (including ACKs): Very limited; keep to a minimum (TTN Fair Use: 10 downlinks per day).
- Duty Cycle: All TTN gateways in EU868 obey the 1% duty cycle regulation—do not exceed minimum intervals above.
- Do not flood the network with test or redundant packets—this affects all users.
The Data Rate (DR) and Spreading Factor (SF) are related and impact range and battery life. Lower DR (higher SF) means longer range but higher power usage and much slower data transfer.
| DR | SF | Min. SNR (dB) | Bitrate (bps) | Airtime (ms) | Min. Sampling Rate |
|---|---|---|---|---|---|
| 5 | 7 | -7.5 | 5470 | 127 | 6 min |
| 4 | 8 | -10 | 3125 | 223 | 11 min |
| 3 | 9 | -12.5 | 1760 | 395 | 19 min |
| 2 | 10 | -15 | 980 | 710 | 34 min |
| 1 | 11 | -17.5 | 440 | 1582 | 1h 16min |
| 0 | 12 | -20 | 250 | 2784 | 2h 14min |
Notes:
- Minimum SNR: If your measured SNR is below the value in this table for the chosen SF, LoRa cannot decode the signal at all.
- Airtime: How long the radio is transmitting for one packet. Longer airtime = higher energy use, shorter battery.
- Min. Sampling Rate: Due to duty cycle regulations (e.g., 1% for EU868), you must not send packets more frequently than this interval at each SF. Violating this can lead to message loss or regulatory issues.
- The minimum sampling rates in this table are calculated using the maximum allowed LoRaWAN payload size.
- If your project uses smaller payloads (amount of sensor values in a telegram and other infos), the minimum allowed sampling interval may be even shorter (messages can be sent a bit more frequently).
- These values are conservative and on the safe side for compliance and network planning.
- Battery life is best with the lowest SF (highest DR) that gives reliable coverage.
- Tip: For field testing, use only the minimum number of test packets, and always comply with the minimum sampling rate for your chosen SF and TTN’s fair use recommendations.
TX Power
This represents the transmit power. More power = longer range, but also more battery consumption and possibly violating regional limits
| TX Power Index on RAK10701-P | Output Power (dBm) |
|---|---|
| 0 | 14 dBm (Max legal for EU/CH) |
| 1 | 13 dBm |
| 2 | 12 dBm |
| 3 | 11 dBm |
| 4 | 10 dBm |
| 5 | 9 dBm |
| 6 | 8 dBm |
| 7 | 7 dBm |
How to Test Coverage
- Charge your tester beforehand
- Mount the antenna on the tester
- Go outside the building
- Switch on the tester by pressing the button on the right side for at least five seconds
- Wait until the GPS has good connection
- Set DR and TX Power:
- TX Power 0 (14dBm) -> maximum Power for first message
- DR: DR0 (SF12) slowest spreading factor to see how many gateways are reachable
- TX Interval: Set it to 3600s, then the ttn network does not get flodded by periodic transmissions. You manually trigger a transmission by pressing the side button twice.
- Send an uplink message by double pressing the side button
- in Grafana select the fieldtester device in both pull-downs
- the result shows the maximum possible reachable gateways
- Set DR and TX Power:
- TX Power 7 (7dBm)
- DR: DR0 (SF7) fastest spreading factor to see how many gateways are reachable
- TX Interval: Leave it on 3600s
- Send an uplink message by double pressing the side button
- the result in Grafana shows the maximum possible reachable gateways with a desirable setting
- so if none gateway is reachable, you have to install own gateways
- if there are some, a try with these gateways inside the building is a good idea
- Send uplink(s) at each location you want to install a device by double pressing the side button.
- Record the results in the Excel sheet from below
- Compare your readings with the RSSI & SNR thresholds. Check if the resulting sampling rate corresponds to your project requirements.
- Adjust: Move sensor/gateway, change SF, increase TX power, or install more gateways as needed.
- Now you can go on and test the locations with the dedicated test devices you wanna use to be shure that a probably smaller antenna is as well reachable.
- you might have less good results, but a resulting spreading factor of SF9 or SF10 is as well good.
- watch the airtime with the device payload, which could be bigger than the fieldtester payload. Make shure, that the sampling rate you wanna have does not exceed a maximum airtime of 30s a day.
- If done, power off the devices, fieldtester by pressing the button on the right side for at least five seconds and press the off icon on the screen.
How to Interpret the Results in Detail
Correctly interpreting your RSSI (Received Signal Strength Indicator) and SNR (Signal-to-Noise Ratio) readings is essential for reliable LoRaWAN operation. Use the tables and troubleshooting tips below to assess results and improve your network.
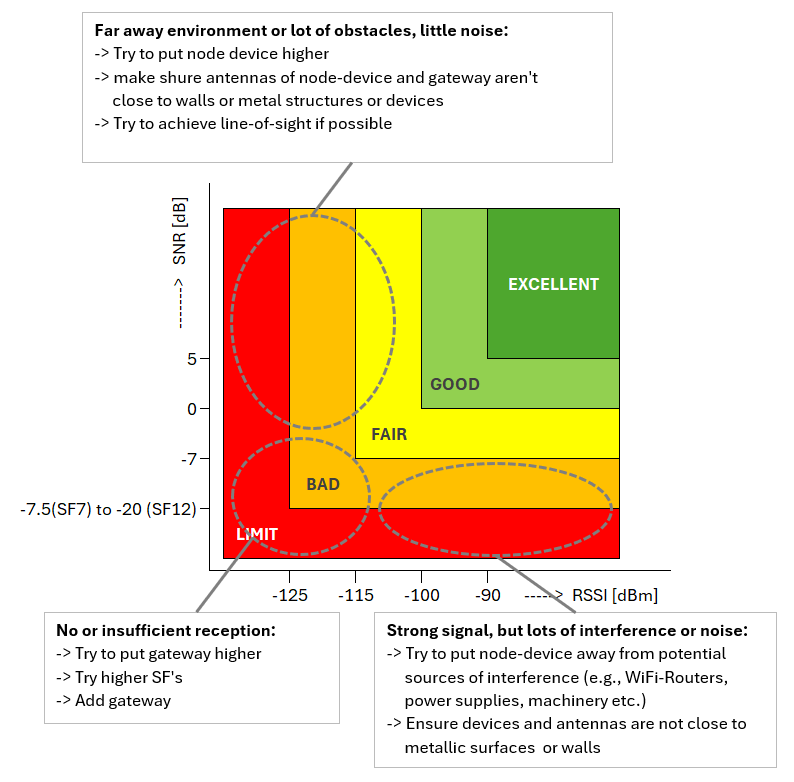
- Low RSSI, Good SNR
- What it means: Signal is weak, but there’s little noise.
- What to do:
- Move sensor or gateway higher.
- Remove obstacles (try for line-of-sight).
- Move sensor/gateway closer.
- Good RSSI, Low SNR
- What it means: Strong signal, but lots of interference or noise.
- What to do:
- Move devices away from interference (Wi-Fi routers, power supplies, industrial equipment).
- Change LoRa frequency (if possible).
- Avoid metallic surfaces or crowded electronics.
- Both RSSI and SNR Low
- What it means: Weak and noisy signal.
- What to do:
- Use higher spreading factor (SF).
- Increase transmit power.
- Add/move gateway centrally.
- Remove major obstacles; try higher-gain antenna.
- Unstable/Fluctuating RSSI or SNR
- What it means: Signal quality changes over time.
- What to do:
- Try different antenna orientations.
- Test at different times of day.
- Secure antennas/cables.
- Check for moving obstacles.
- Good RSSI and SNR but Packet Loss
- What it means: Signal is fine, but uplinks are missing.
- What to do:
- Check for duty cycle violations (too many messages).
- Check for gateway congestion.
- Check device settings (ADR/SF mismatches).
- Strong Signal Near Gateway, Weak Far Away
- What it means: Coverage not uniform.
- What to do:
- Add gateways in dead zones.
- Use a repeater if supported.
- Reposition gateway for more central coverage.
- Unexpected Drop in RSSI/SNR Over Time
- What it means: Signal quality worsened recently.
- What to do:
- Look for new obstacles, equipment, or construction.
- Inspect cables, connectors, and antenna attachment.
- Sensor Only Works with High SF
- What it means: Marginal link—signal barely reaches gateway.
- What to do:
- Move device or gateway for even small improvement.
- Use external or higher-gain antenna.
- Multiple Sensors Interfering
- What it means: Sensors too close or transmitting at the same time.
- What to do:
- Space out sensors.
- Stagger transmissions if possible.
- Enable ADR for auto-optimization.
Tips
When to Install or Move a Gateway
Install or move a gateway if:
- Many locations show weak or no coverage (RSSI < -115 dBm, SNR < -7 dB, or only SF12 works)
- Only one gateway receives your tester in key spots
- High packet loss, failed joins, or regulatory violations (duty cycle)
- You cannot reach sampling rates which fullfill your requirements for the project
Device Placement
Gateways
- Place gateways high and central.
- Avoid metal enclosures and dense walls.
- Use an external antenna if possible.
Sensors
- Mount at least 1 meter from the gateway antenna
- Antenna vertical, not pressed against metal or walls
- Document obstacles and re-test after moving/installing gateways
Reliable Testing
- Test at different times of day (people and machinery can affect RF)
- Wait for results at each location
- Note and document obstacles, metal, and EMI sources
- Do not exceed duty cycle regulations (see Min. Sampling Rate table)
- In the final setup, use Adaptive Data Rate ADR (only for stationary devices)
- Use lowest TX power and highest DR that still gives reliable communication.
- Avoid DR0 unless necessary – very slow and uses a lot of airtime.
- Don’t flood TTN with test packets – it’s a shared, fair-use network.
- If the screen of the tester shows a lock icon on bottom right, then you can press the side button once to leave the locked mode.
Further Resources
- The Things Network Mapper – for outdoor mapping coverage
- LoRaWAN Knowledge Base
- LoRaWAN Tester Quick Start Guides
- RSSI and SNR Youtube Video
- Lora Propagation, Range, Antennas, and Link Budget Youtube Video
- Airtime calculator for LoRAWAN
- TTN’s Airtime calculator for LoRAWAN